
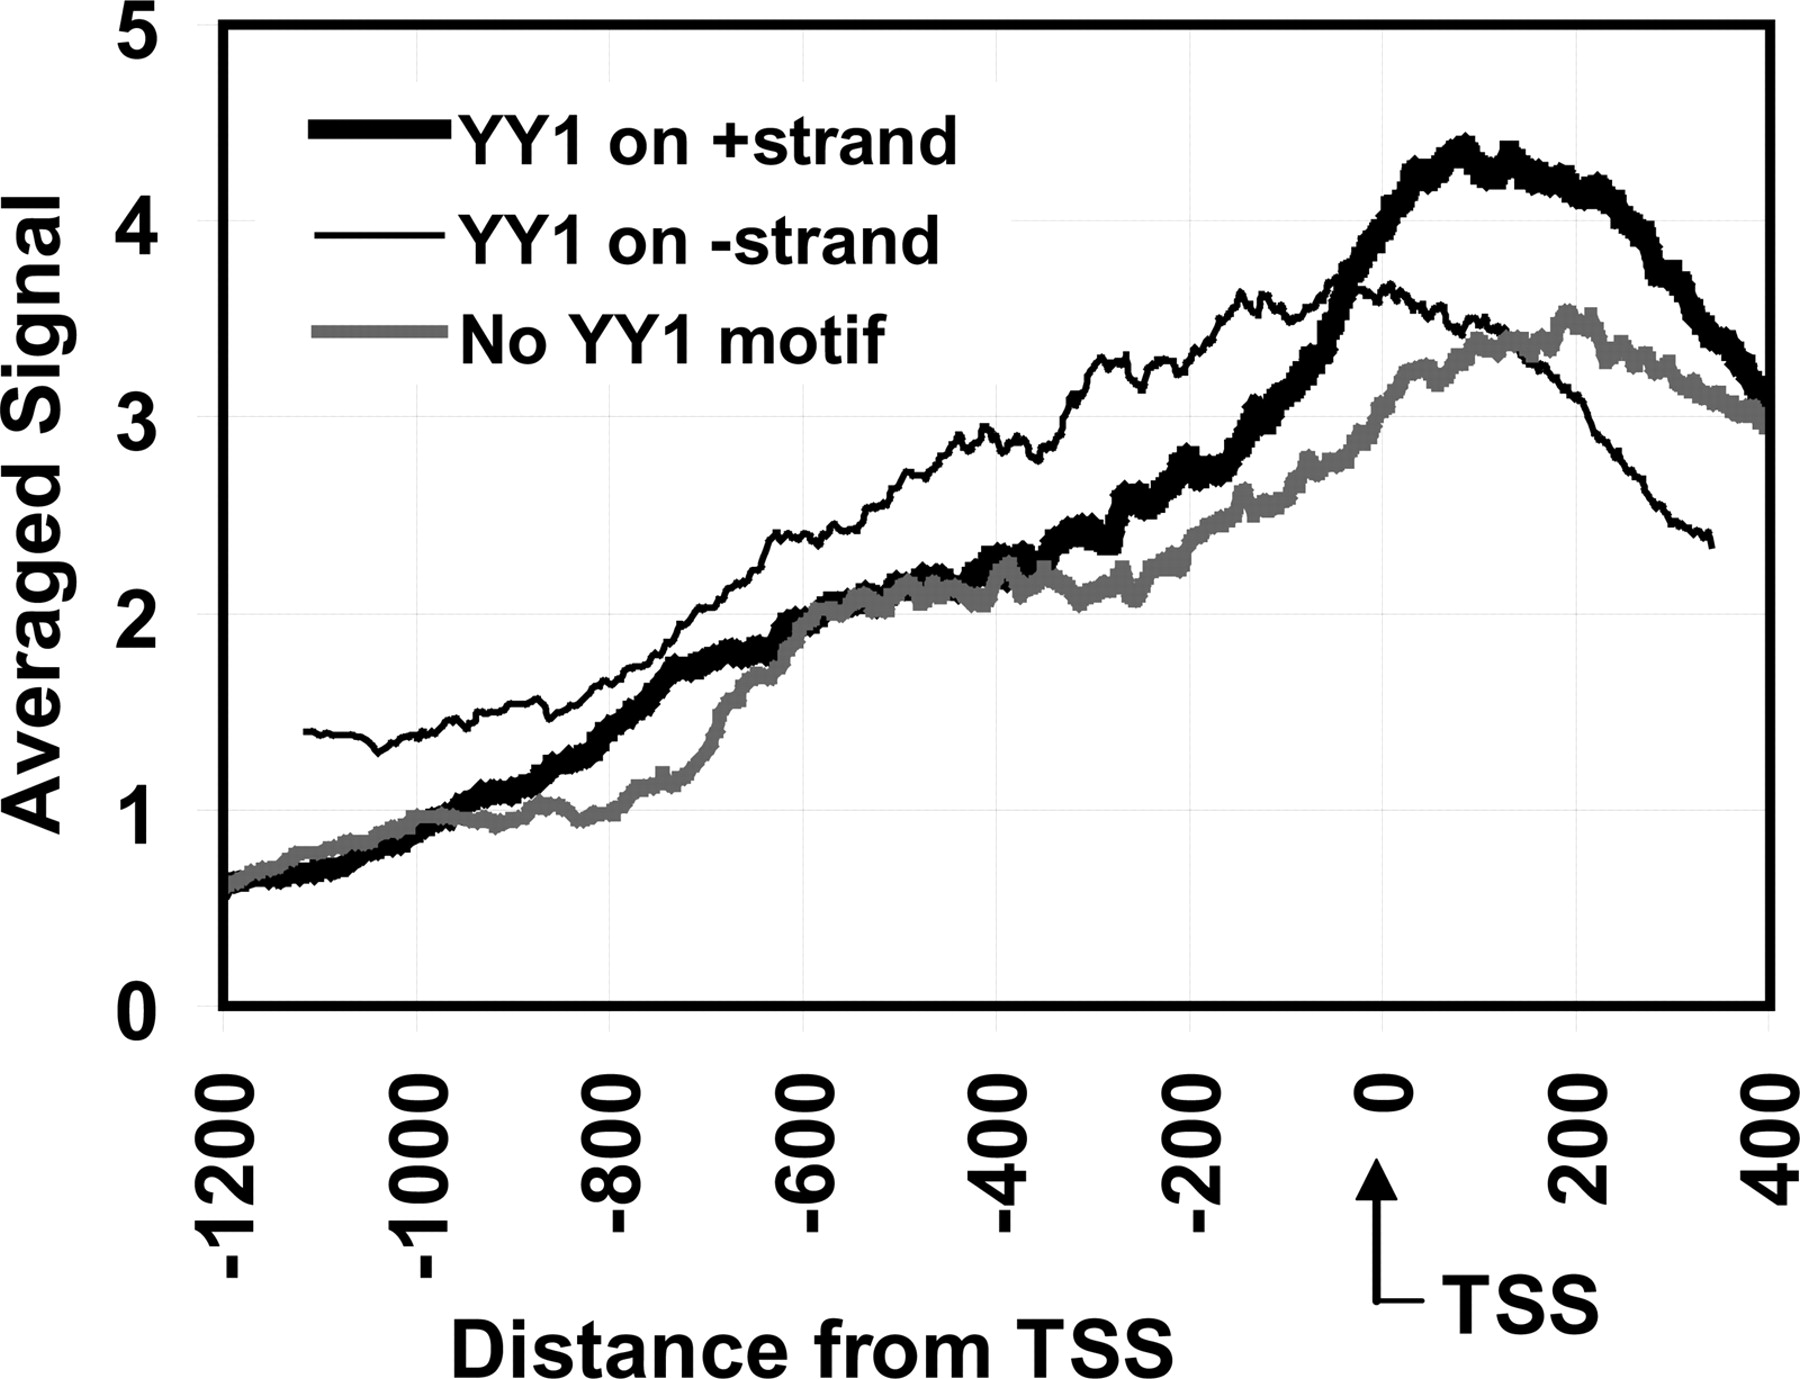
Figure 5.
Positional distribution of averaged ChIP signal relative to the TSS for ChIP hits. Thick black curve: ChIP hits with a YY1 motif match on the plus strand (P <0.00001). Thin black curve: ChIP hits with a YY1 motif match on the minus strand (P <0.00001). Thick gray curve: ChIP hits without a YY1 motif match on either strand.


