
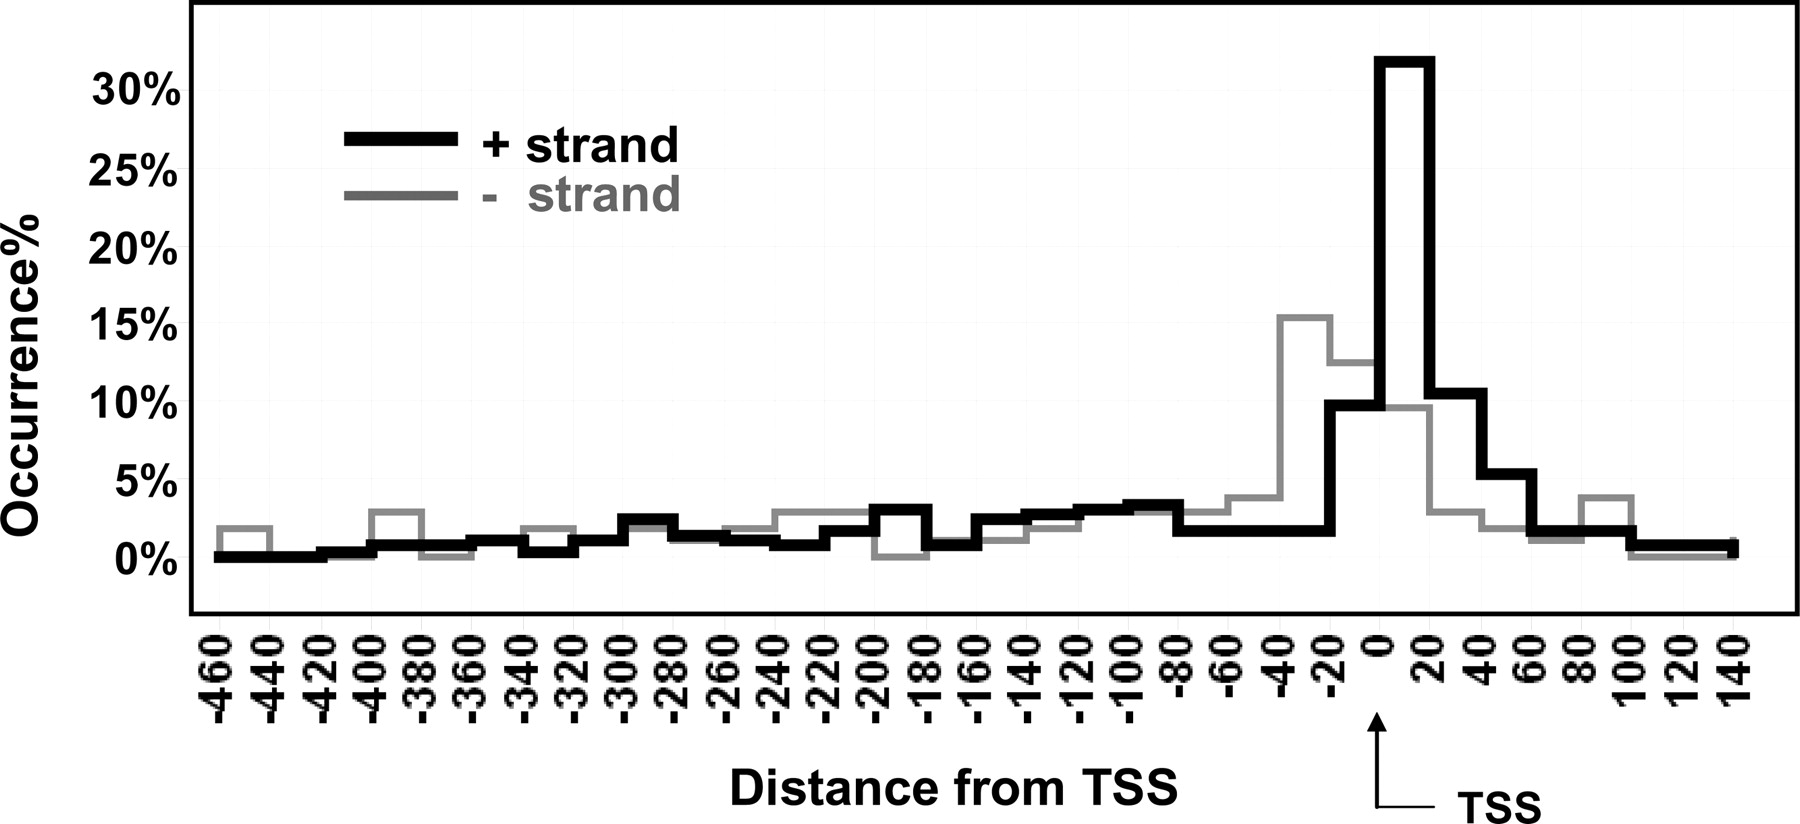
Figure 4.
Positional distribution of YY1 sites relative to the TSS for ChIP hits. Thick black line: distribution on the plus strand. Thin gray line: distribution on the minus strand. Different positional specificities were observed for YY1 sites on plus and minus strands.


