
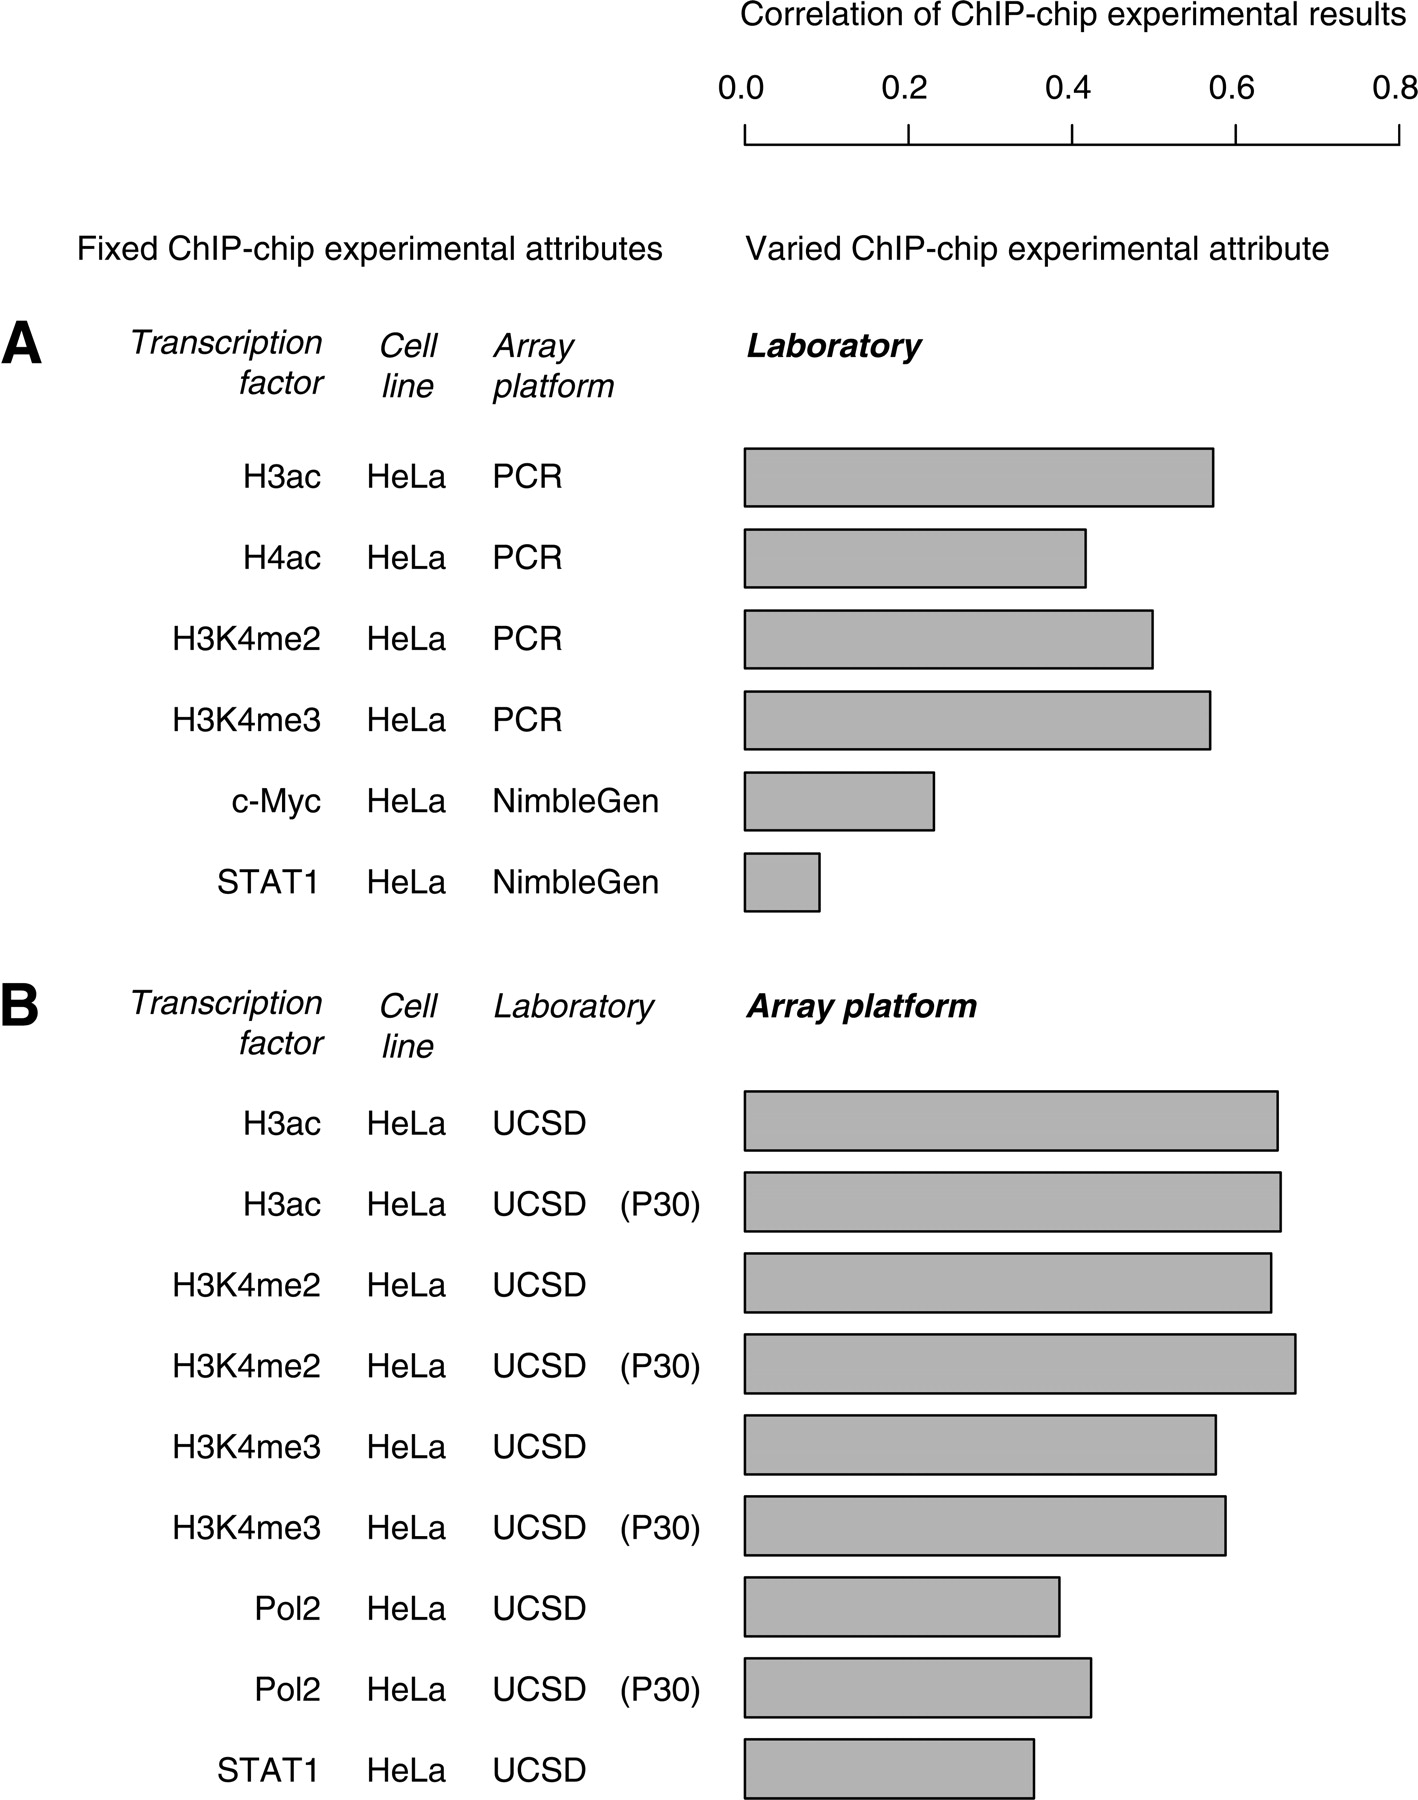
Data quality measured by the correlation of two ChIP–chip experiment results. (A) Data reproducibility between two different laboratories. Each bar gives the correlation coefficient between the results of two ChIP–chip experiments performed by two laboratories that assayed the same transcription factor in the same cell line on the same array platform. The pairs of laboratories in all six comparisons are not necessarily the same. (B) Data reproducibility between PCR and NimbleGen tiling microarrays. Each bar gives the correlation coefficient between the results of two ChIP–chip experiments performed by the same laboratory that assayed the same transcription factor in the same cell line on both PCR and NimbleGen tiling microarray platforms.


