
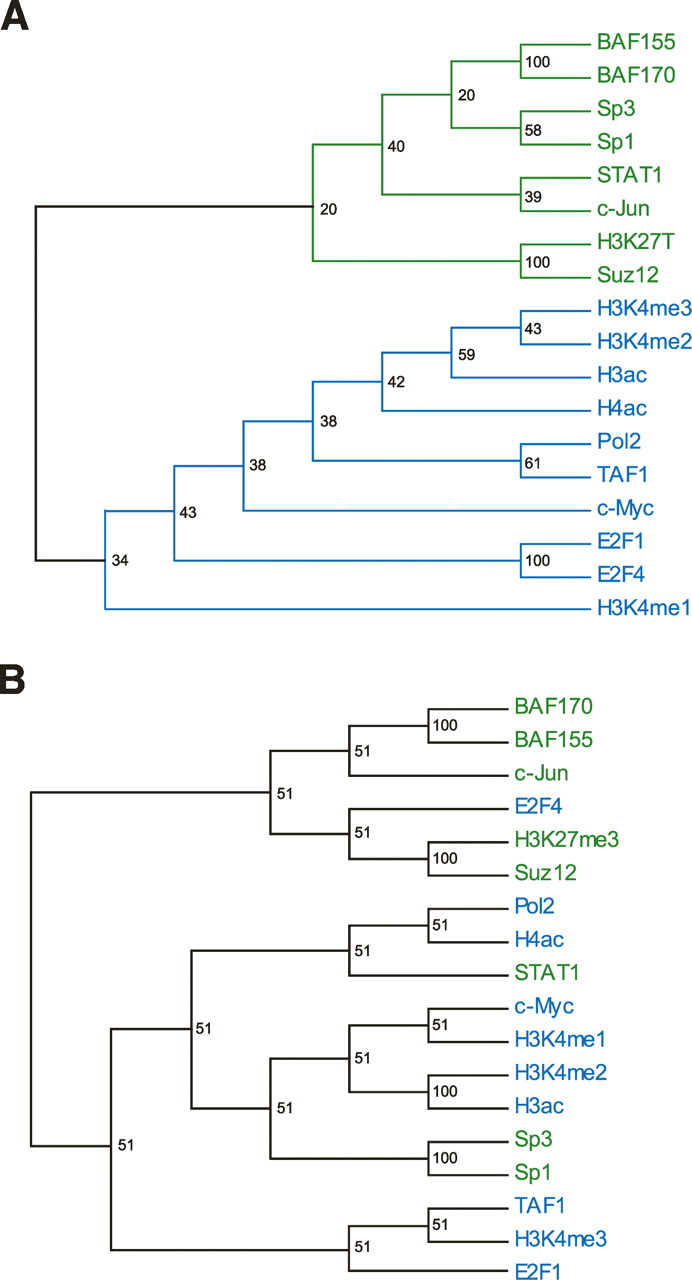
Figure 7.
Interrelationship of transcription factors. (A) Consensus correlation dendrogram of the same 18 transcription factors as shown in Figure 6B. Bootstrap values are shown at the branching points. Notice the very similar relationship among these 18 transcription factors revealed by these two different methods. (B) Hierarchical clustering of the same 18 transcription factors as in A, but with only TREs >2 kb away from GENCODE-annotated transcription start sites. BAF155 and BAF170 currently known as SMARCC1 and SMARCC2, respectively.


