
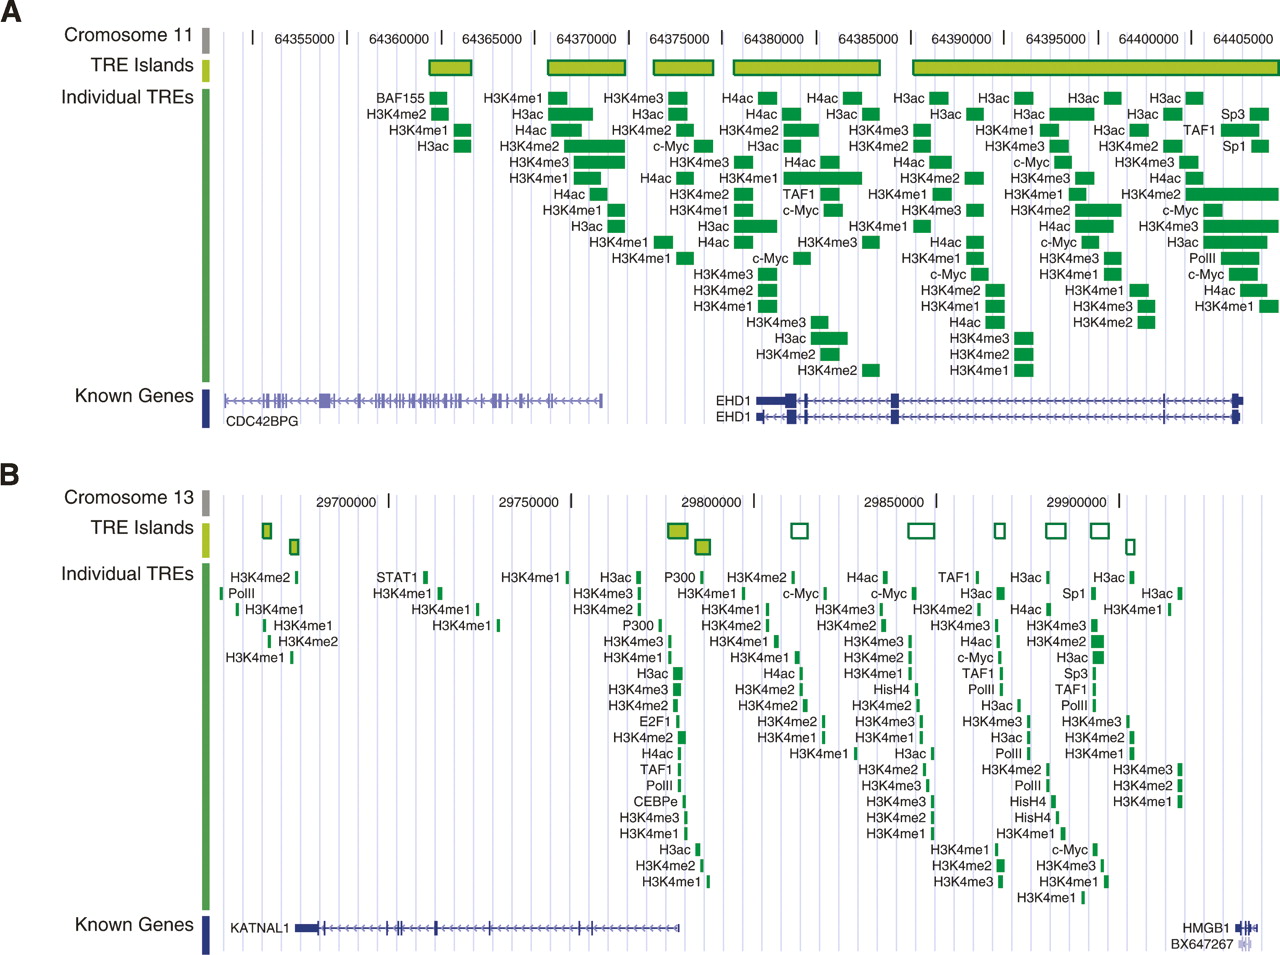
Figure 4.
Samples of TRE islands. (A) TRE islands that cover the entirety of EHD on chromosome 11. (B) TRE islands in the 100-kb intergenic region between KATNAL1 and HMBG1 on chromosome 13. TRE islands, individual component TREs, and known genes are shown on three different tracks. In B, the distal intergenic TRE islands are shown as white boxes with green borders. The genomic coordinates of both chromosome 11 and 13 are based on the NCBI build 35 of the human genome assembly.


