
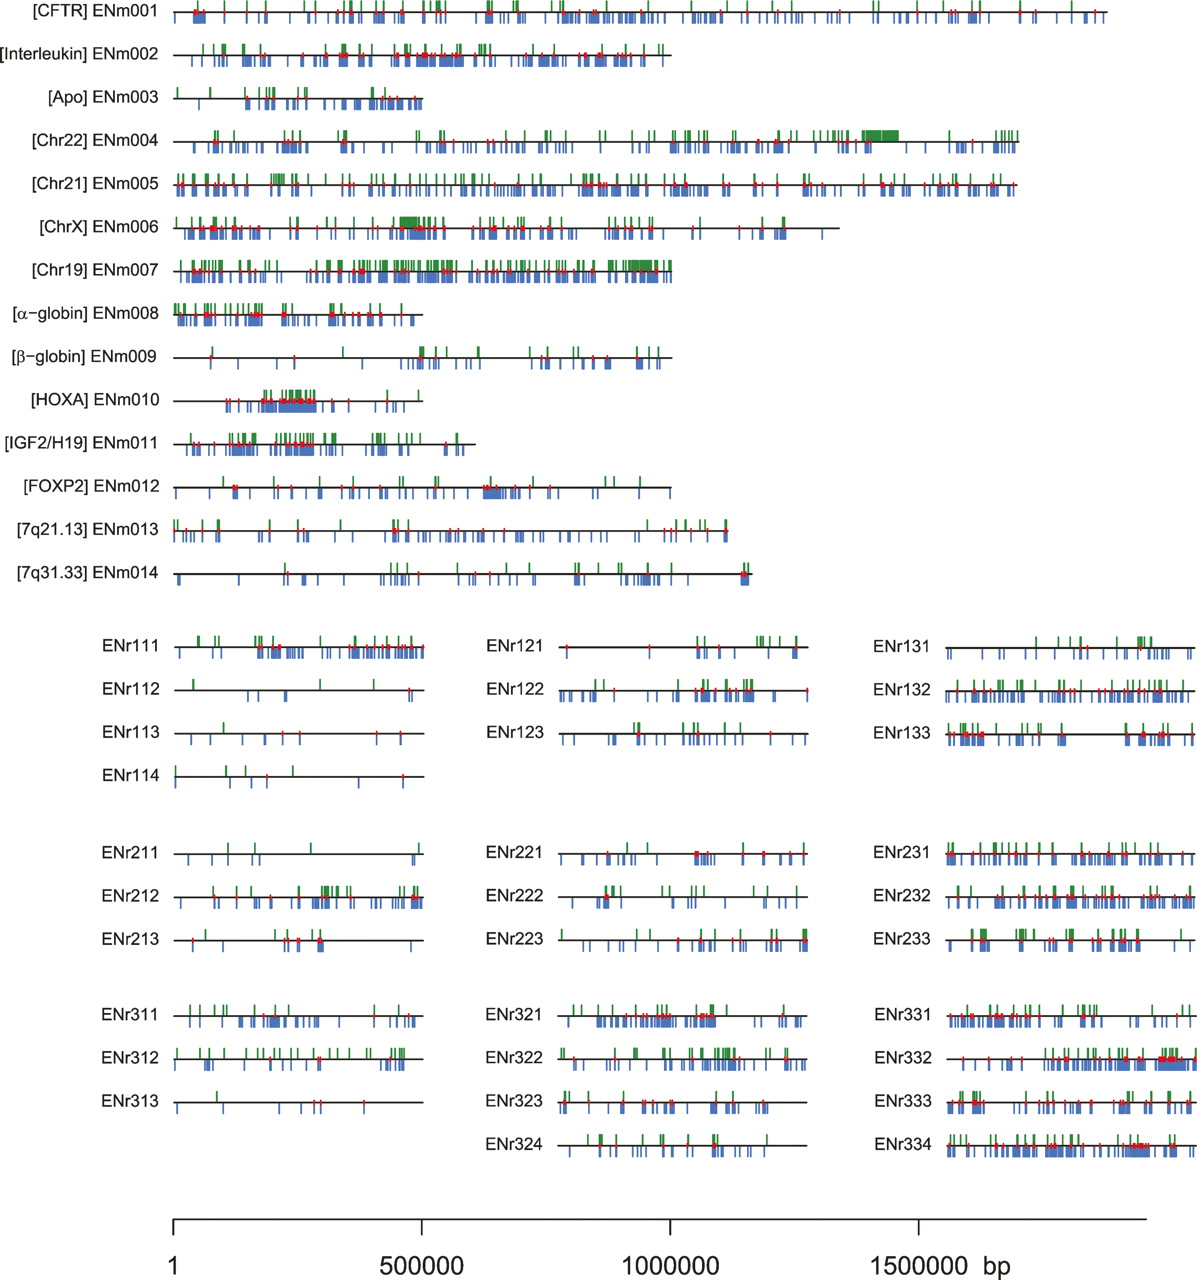
The landscape of the TREs identified by the 105 ChIP–chip experiments in the ENCODE regions. The green and blue ticks represent TREs of sequence-specific and sequence-nonspecific transcription factors identified by the original experiments respectively. The smaller red ticks mark the locations of genomic elements from the integrated tree-weighted composite list (Trinklein et al. 2007). The placement of 30 randomly picked ENCODE regions (ENr—) in a three-by-three table reflects the stratification in their original selection: The rows are 0%–50%, 50%–80%, and 80%–100% nonexonic conservation from top to bottom, and the columns are 0%–50%, 50%–80%, and 80%–100% gene density from left to right.


