
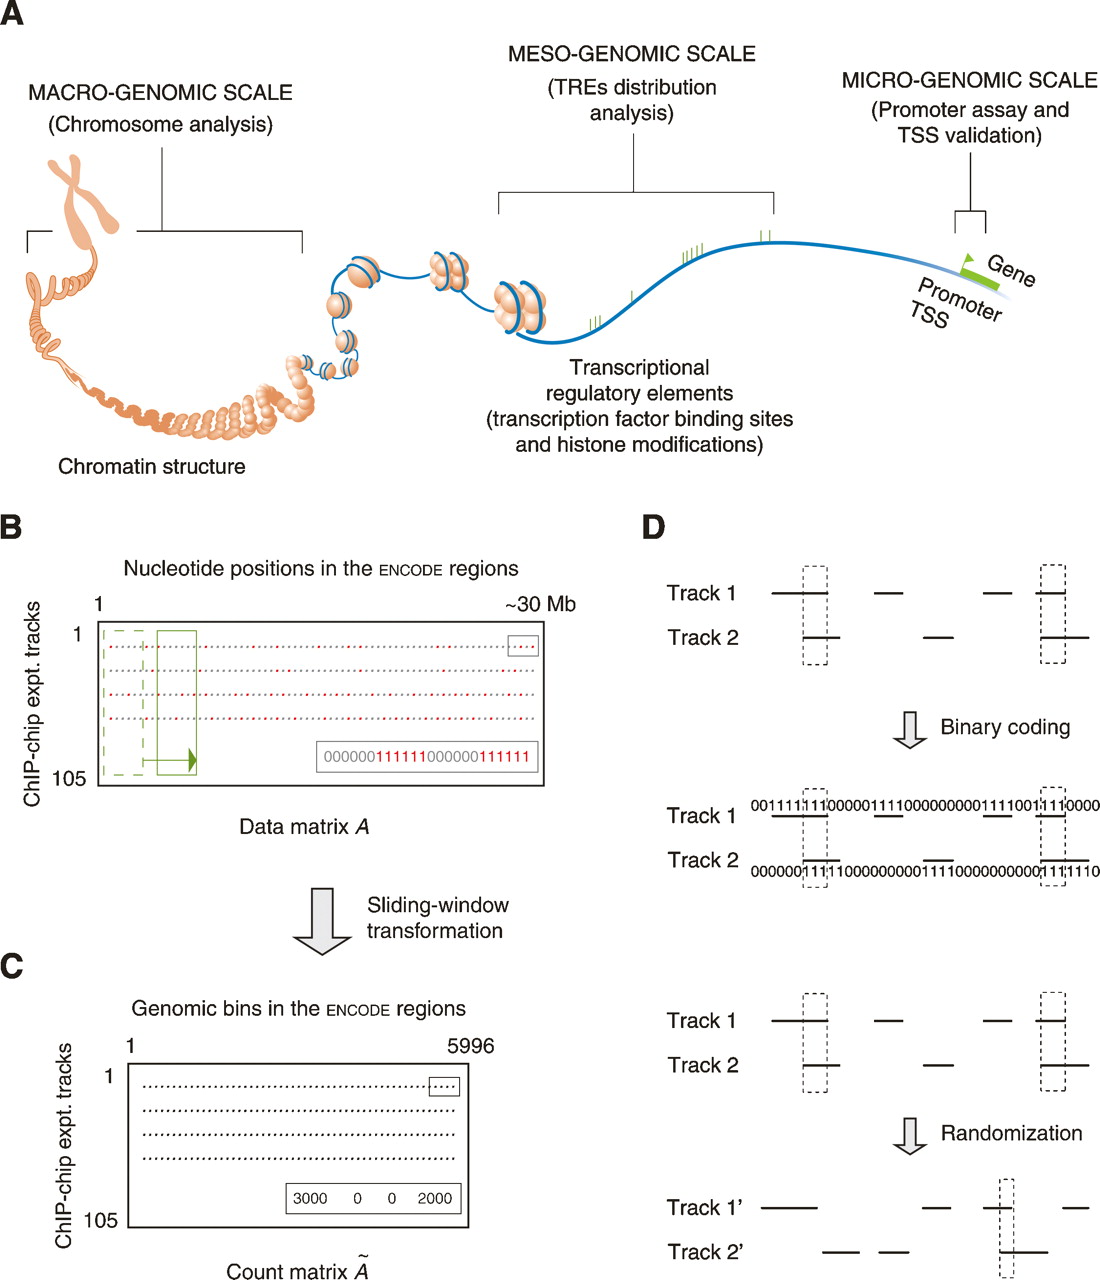
Schematic introduction of the several concepts used in this study. (A) Studies of different transcription factors and their regulatory elements on various genomic levels. (TRE) Transcriptional regulatory element; (TSS) transcription start site. (Modified from The ENCODE Project Consortium 2004 and reprinted with permission from AAAS [www.sciencemag.org] © 2004.) (B) The binary data matrix. Each row is the result track of a ChIP–chip experiment. Red dots are identified transcriptional regulatory elements, in which each nucleotide position is coded as one. (C) The count matrix. A sliding window (the green boxes in B) was used to incorporate contextual information from neighboring positions. Each gray dot represents the number of nucleotide positions in TREs in a sliding window. (D) Correlating two ChIP–chip tracks. The correlation can be done on either two binary vectors or two corresponding count integer vectors (actually used, not shown). Two tracks can also be randomized to generate a background distribution of the correlation.


