
Table 2.
Sensitivity of different scores when specificity is fixed at 0.75
Click on table to view larger version.
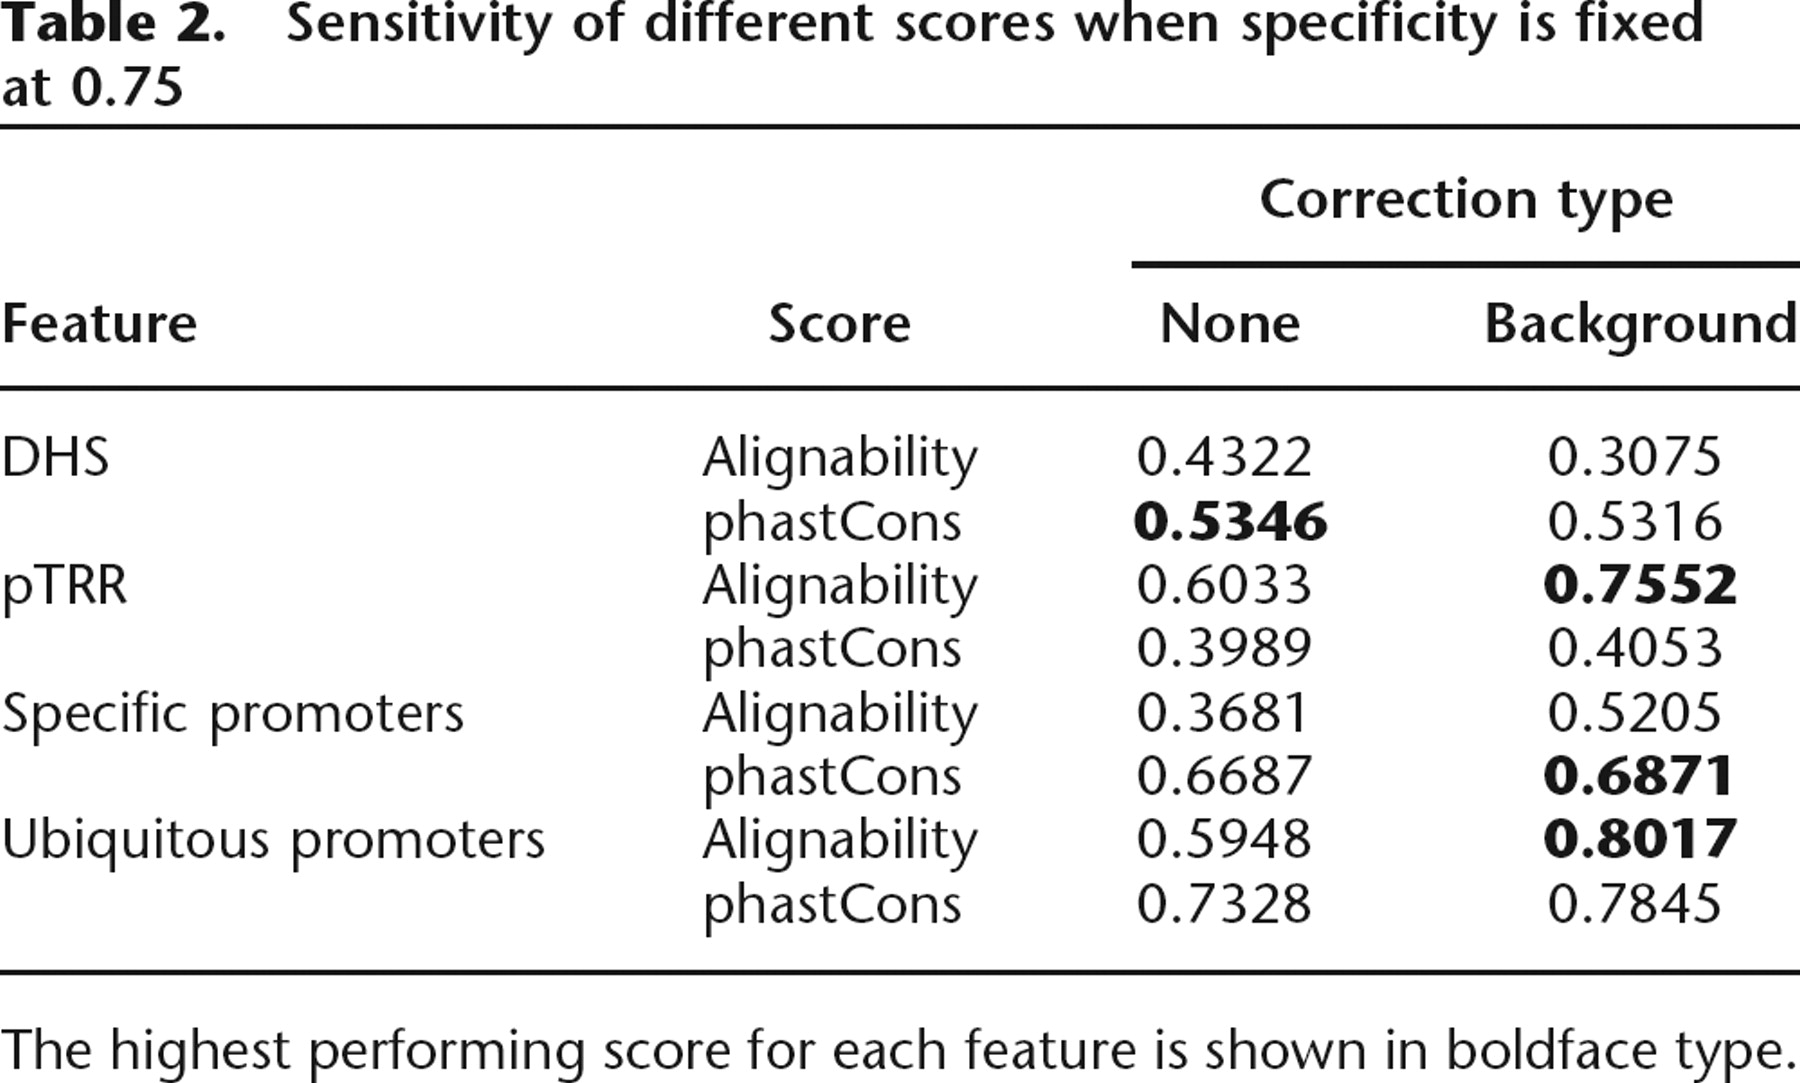
The highest performing score for each feature is shown in boldface type.
Click on image to view larger version.
Sensitivity of different scores when specificity is fixed at 0.75
Click on table to view larger version.
The highest performing score for each feature is shown in boldface type.
 CiteULike
 Delicious
 Digg
Digg Facebook
 Google+
 Reddit
 Twitter
