
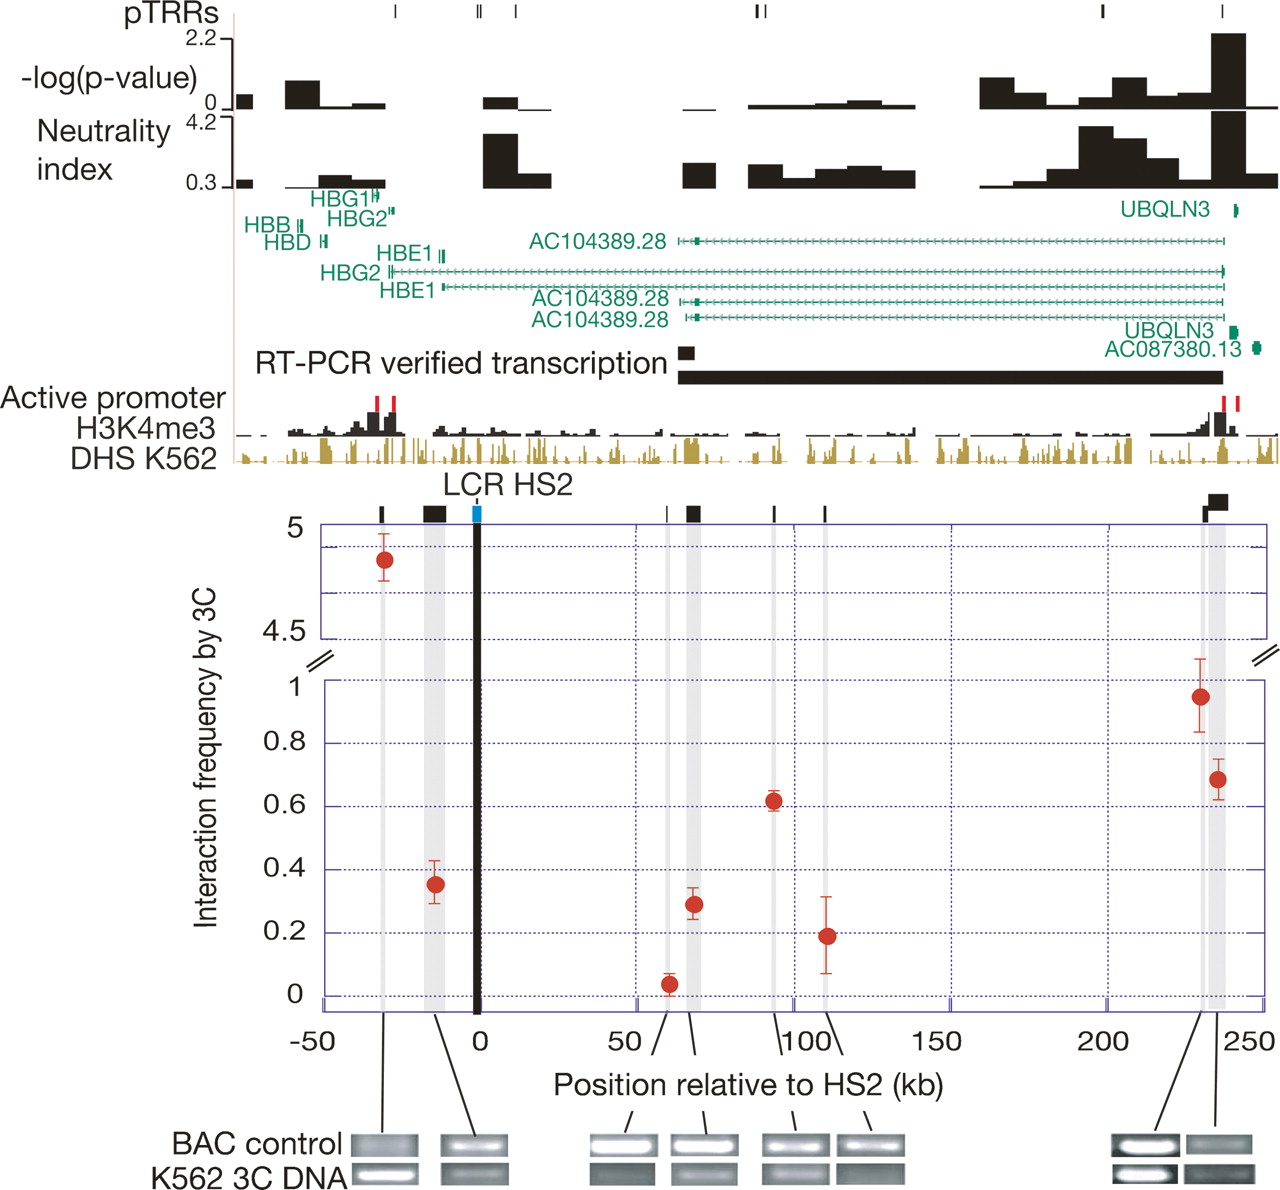
Recent purifying selection in a distal promoter for a noncoding transcript. The customized view from the UCSC Genome Browser (top) covers 315 kb of ENCODE region ENm009 extending from the HBB gene complex to the distal gene UBQLN3 (chr11:5,185,001–5,500,000 in the May 2004 assembly of the human genome). Many tracks are the same as in Fig. 5. In addition, the figure shows trimethylation on lysine 4 of histone H3 and DHSs in the cell line K562 (The ENCODE Project Consortium 2007), along with maps of transcripts independently confirmed by RT-PCR in K562 cells in this study. The graph in the middle, which is aligned with the Browser view, shows the frequencies of interaction among the HindIII DNA fragments indicated by the black rectangles above the graph, using chromosome conformation capture (Dekker et al. 2002). Data shown are the average of two independent experiments, with each measurement normalized to the BAC DNA control (a BAC containing these segments of human chromosome 11 that is digested and ligated by the same procedure as the chromosomal DNA in K562 cells). Images of electrophoretic gels are below the graph; they indicate the abundance of the PCR products for each 3C interaction, both for the BAC control (top row) and the interactions in K562 cells (bottom row).


