
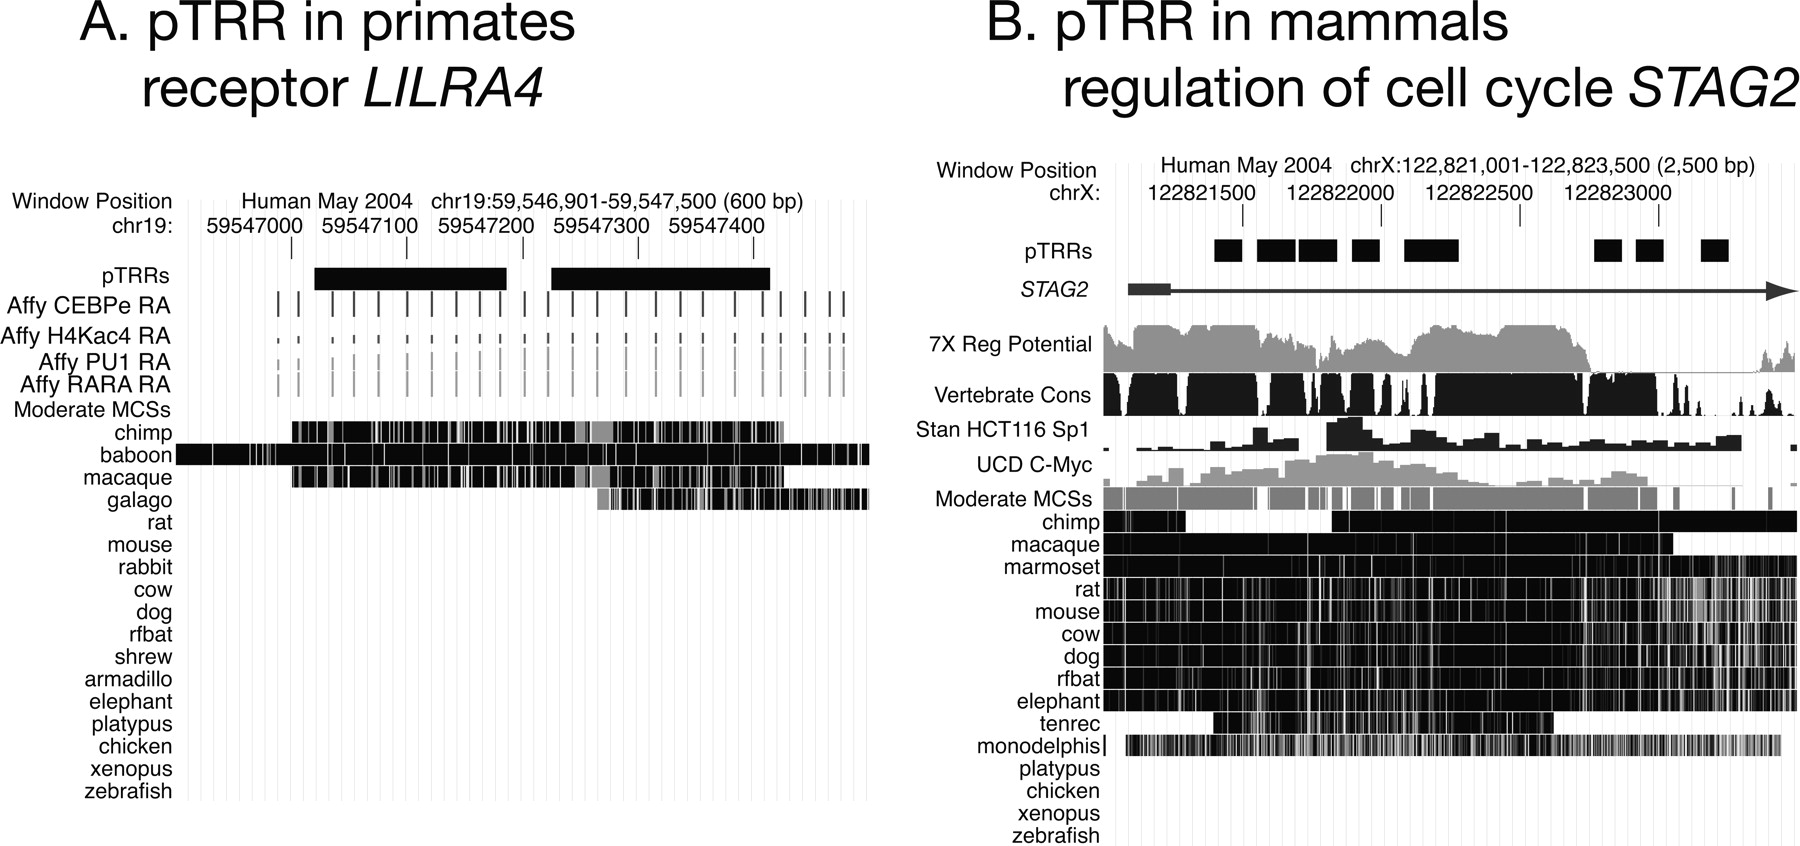
Examples of clade-specific pTRRs. The panels show views from the UCSC Genome Browser (Thomas et al. 2007), focused on pTRRs found only in primates (A, close to the LILRA4 gene) or in mammals including marsupials (B, within the STAG2 gene). The tracks from top to bottom show the pTRRs (black rectangles), the gene if the pTRR is in a gene, the ENCODE transcription-related data (The ENCODE Project Consortium 2007) that led to the identification of a pTRR, the moderate MCSs (Margulies et al. 2007), and the positions of segments aligned with the indicated comparison species using TBA (Blanchette et al. 2004). The transcription-related ENCODE data tracks are ChIP–chip data from Affymetrix on occupancy in HL60 cells by CEBPE, PU.1 (SPI1), and the retinoic acid receptor as well as hyperacetylation of histone H4 (A), and ChIP–chip data from Stanford on occupancy in HCT116 cells by SP1 and from the University of California at Davis on occupancy in HeLa cells by MYC (B). Panel B also shows the scores for regulatory potential (Taylor et al. 2006) and phastCons (Vertebrate Cons; Siepel et al. 2005).


