
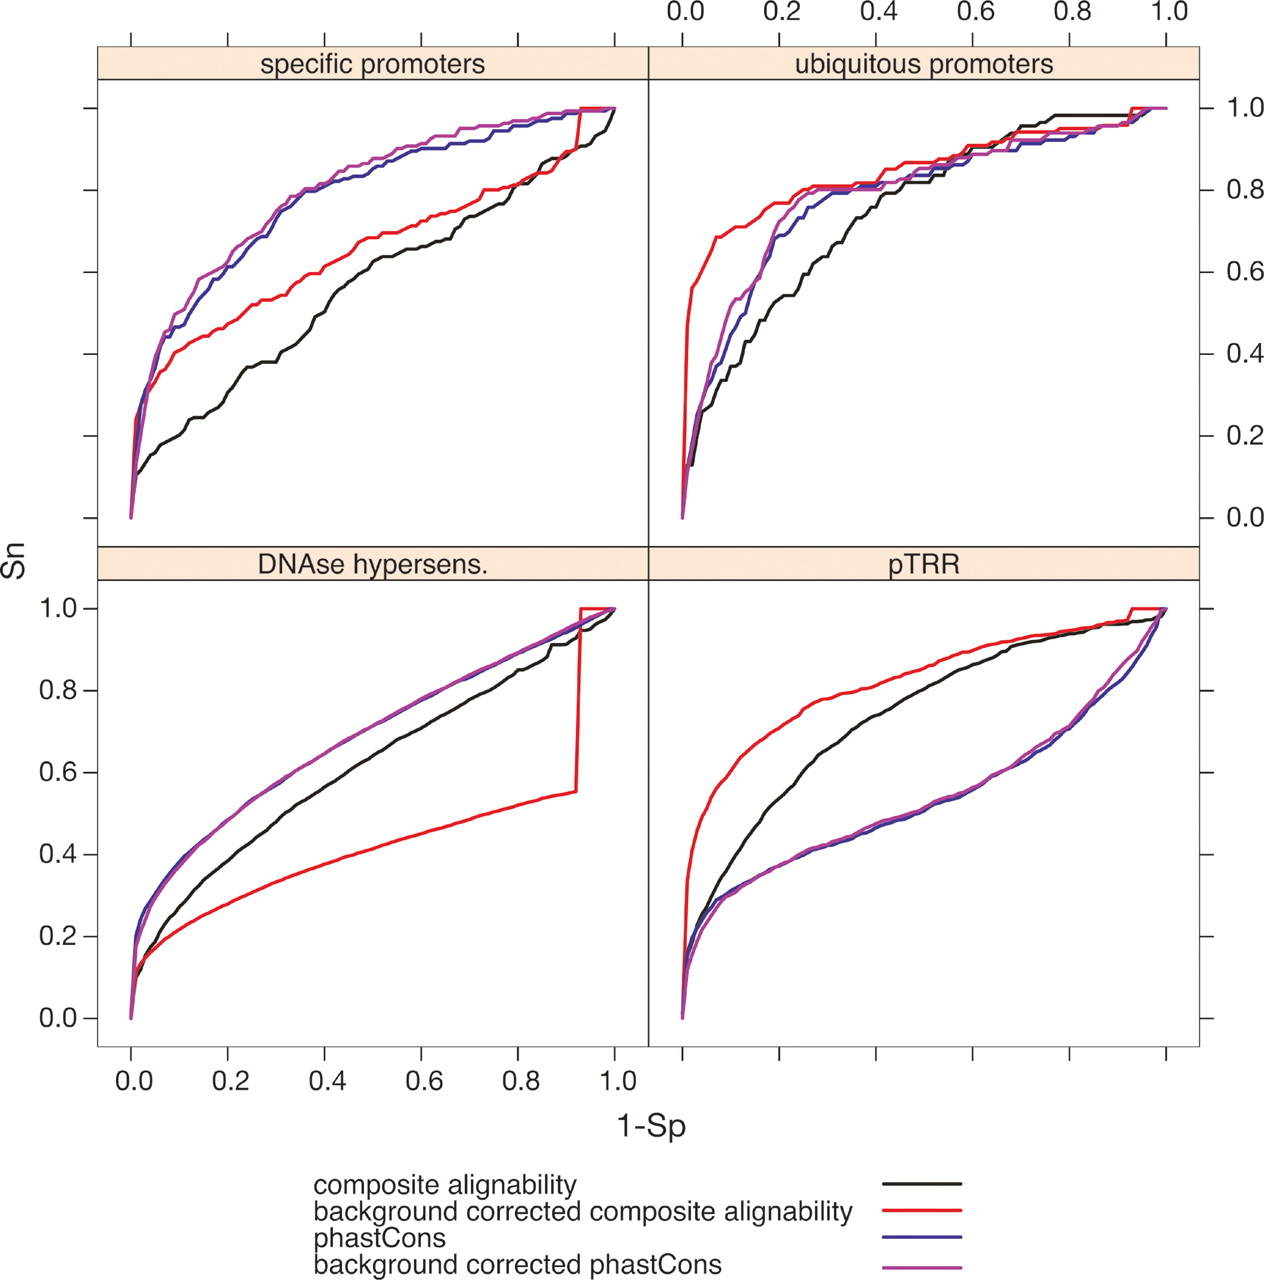
Figure 3.
Receiver operator characteristic (ROC) graphs showing the performance of alignment-based scores to discriminate regulatory regions from neutral DNA. The ROC graphs show the sensitivity (Sn) and 1 − specificity (1 − Sp) as the alignability and phastCons thresholds are increased. Clear discrimination leads to curves deflected into the upper left quadrant of the graph. Sensitivity is measured as the ability to capture members of the four indicated sets of regulatory regions. Specificity is measured as the ability to exclude ARs, a model of neutral DNA. The results are given for each score, before and after regional background correction.


