
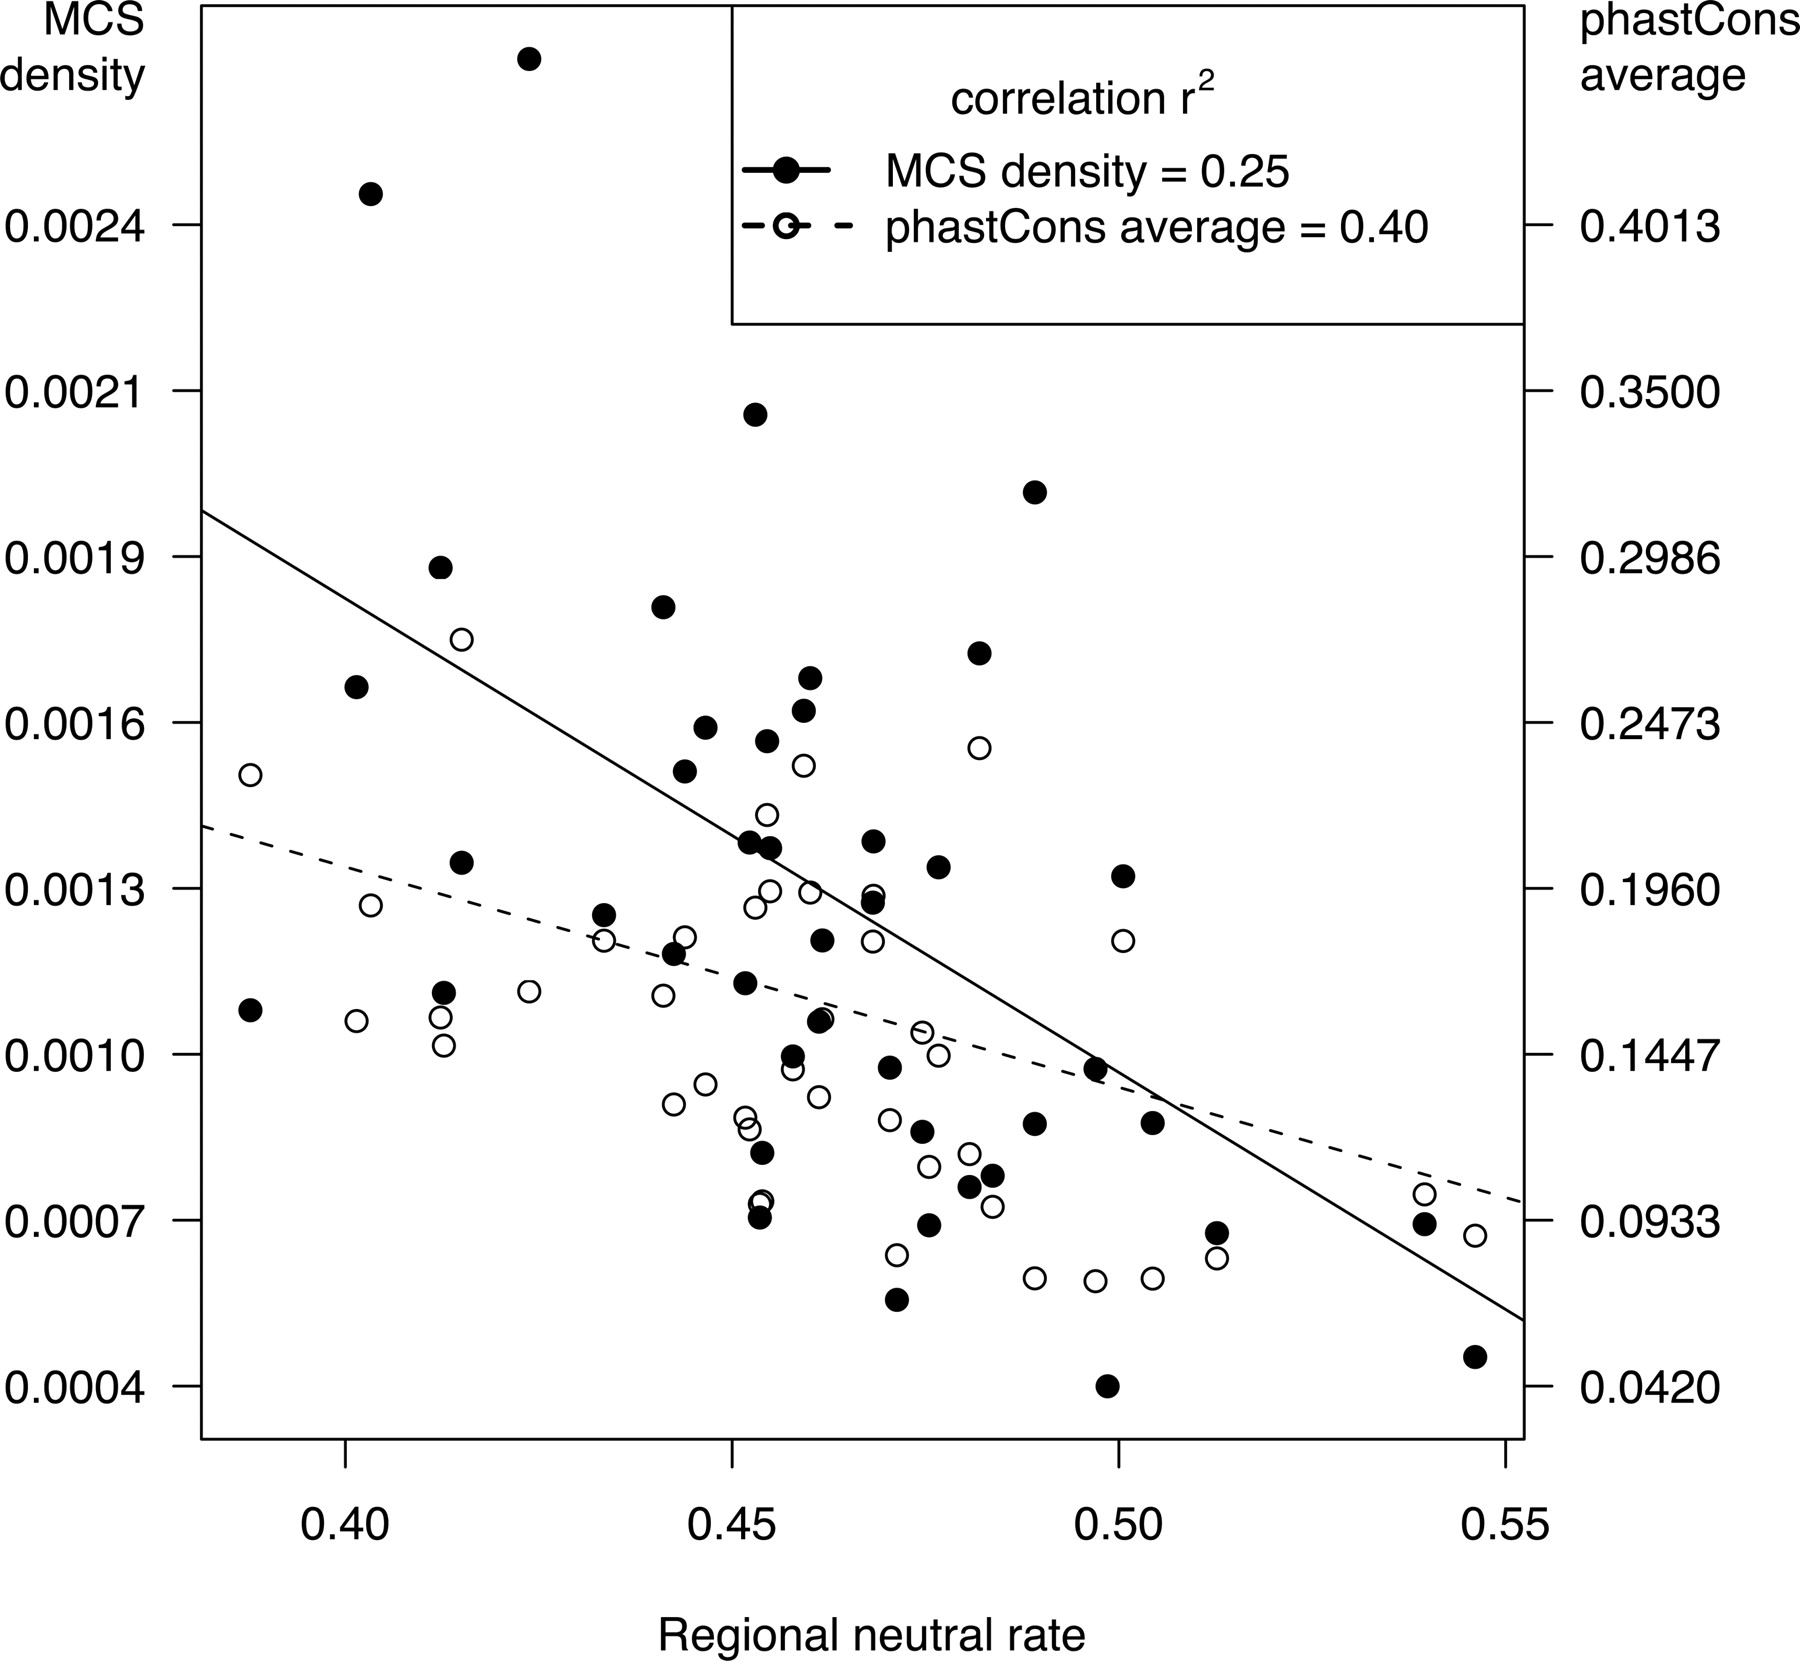
Figure 1.
Negative correlation of neutral rate with measures of constraint. For each ENCODE region, the MCS density per nucleotide (black) and the phastCons average (red) are plotted against the human–mouse substitution rate in ARs (tAR, an estimate of the neutral rate of substitution). The correlations with tAR are −0.50 (P = 0.0005) and −0.64 (P = 3 × 10⁻⁶) for MCS density and phastCons, respectively; the inset gives the r2 values.


