
Table 1.
Density of constraint predictions for each alignment/constraint method combination
Click on table to view larger version.
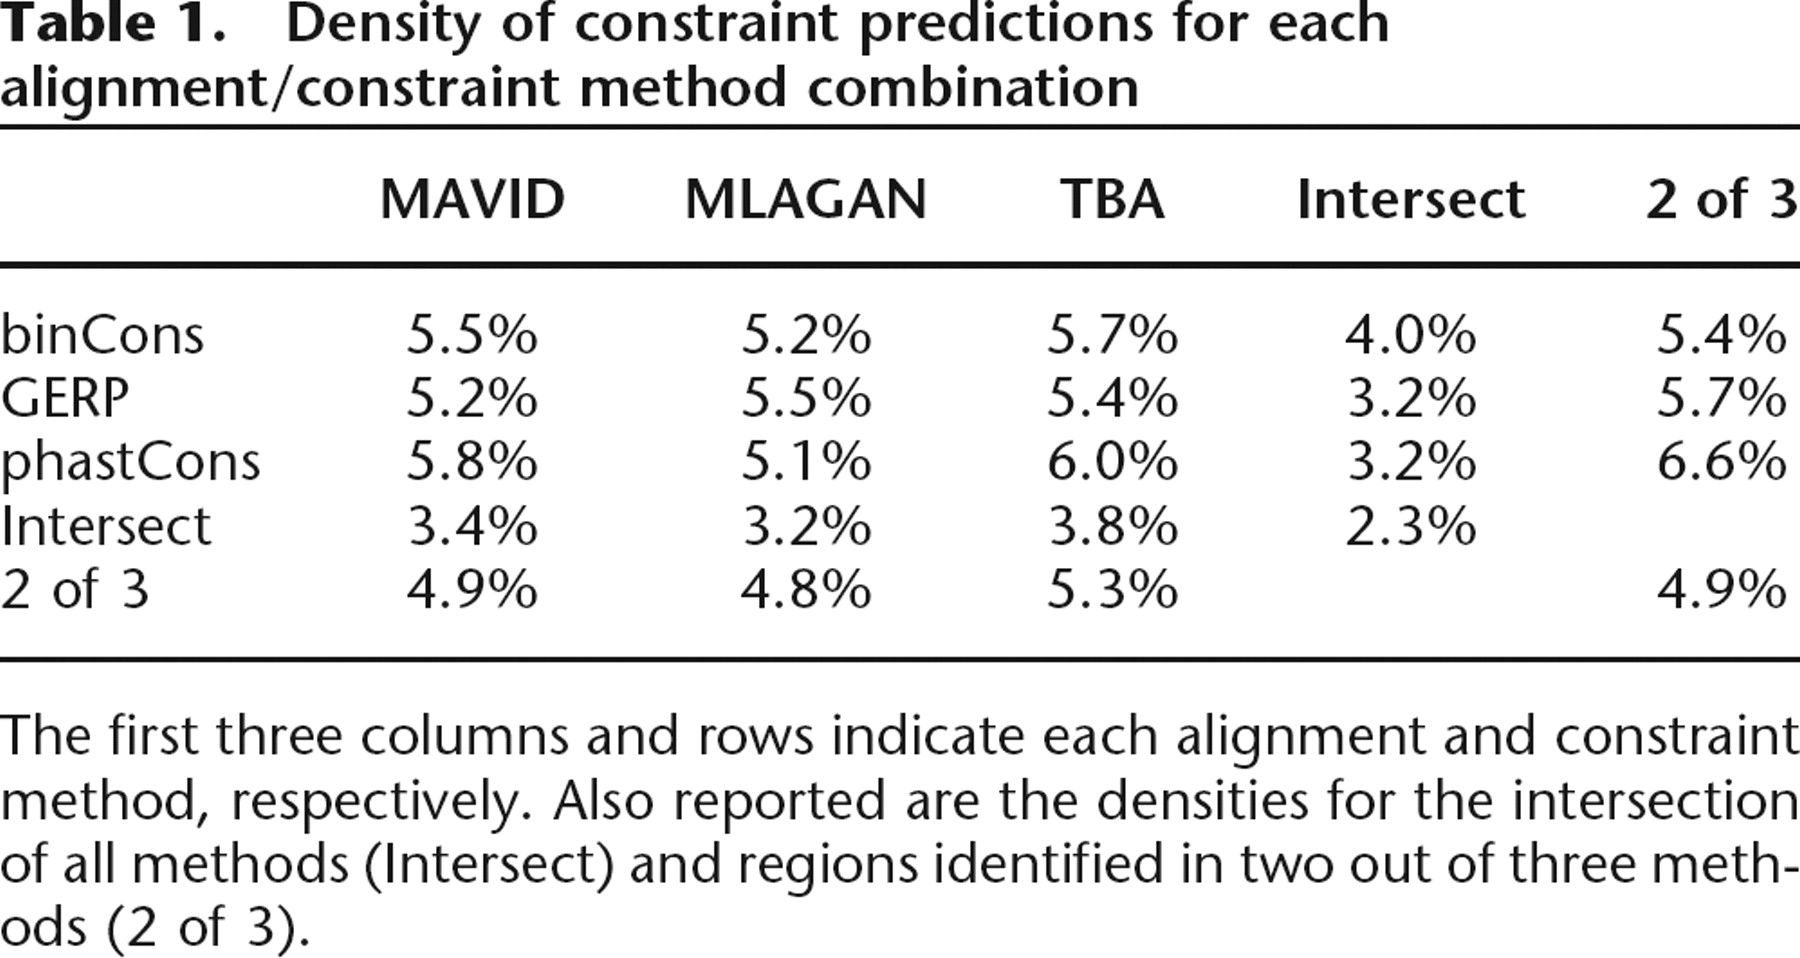
The first three columns and rows indicate each alignment and constraint method, respectively. Also reported are the densities for the intersection of all methods (Intersect) and regions identified in two out of three methods (2 of 3).


