
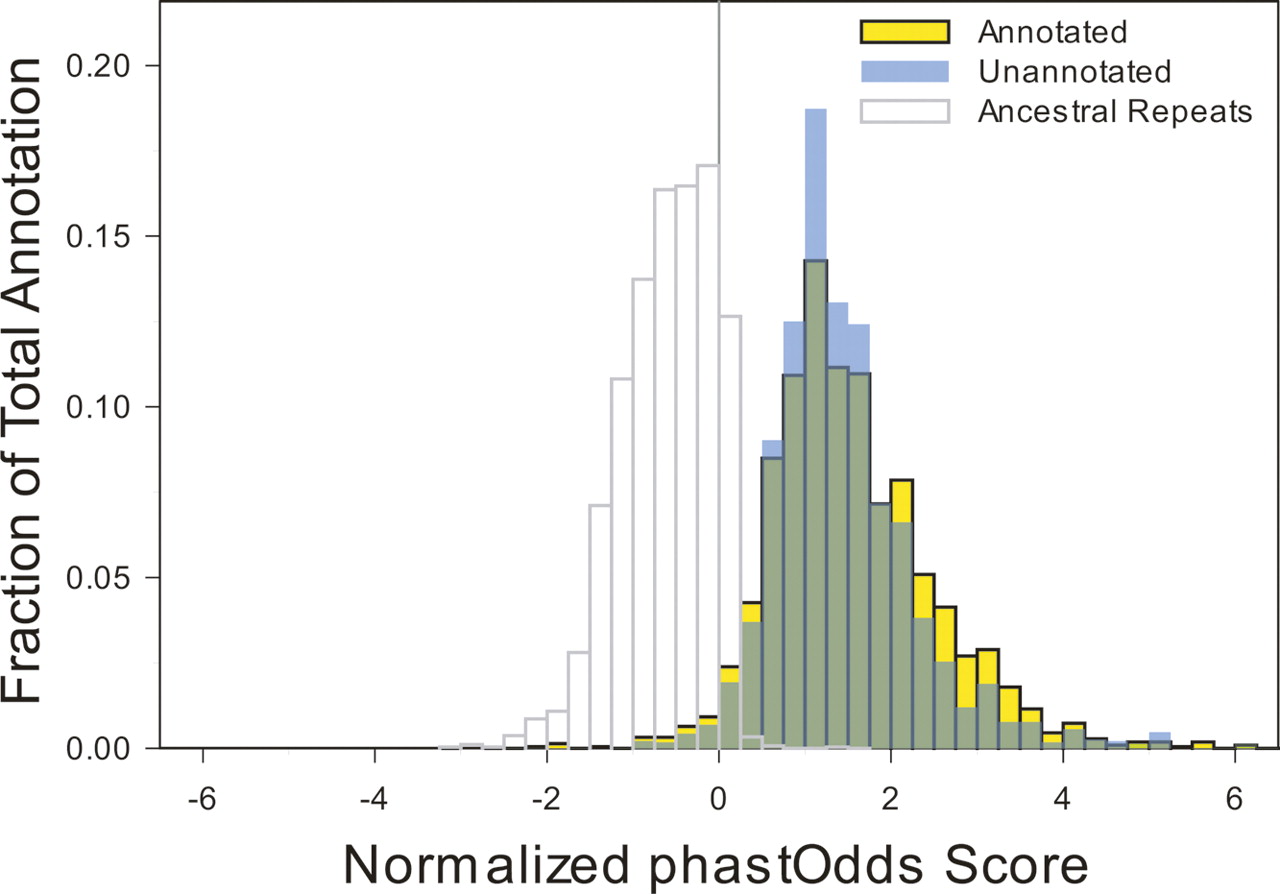
Annotated versus unannotated constrained sequences. For each block of constrained sequence, a score based on the log-likelihood of observing such a sequence under a model of constrained versus neutral evolution was computed using the phastOdds program (Siepel et al. 2005). These values were divided by the length of each block to compute a normalized per-base log-likelihood that reflects constraint intensity (X-axis). These values were plotted as a frequency histogram (Y-axis) for the blocks of constrained sequences that do (yellow) or do not (blue) overlap an experimental annotation. The distributions largely overlap (green), even at the extreme positive end in which highly constrained sequences reside. For comparison, the distribution for ancestral repeat sequences is shown as a representation of largely neutral DNA.


