
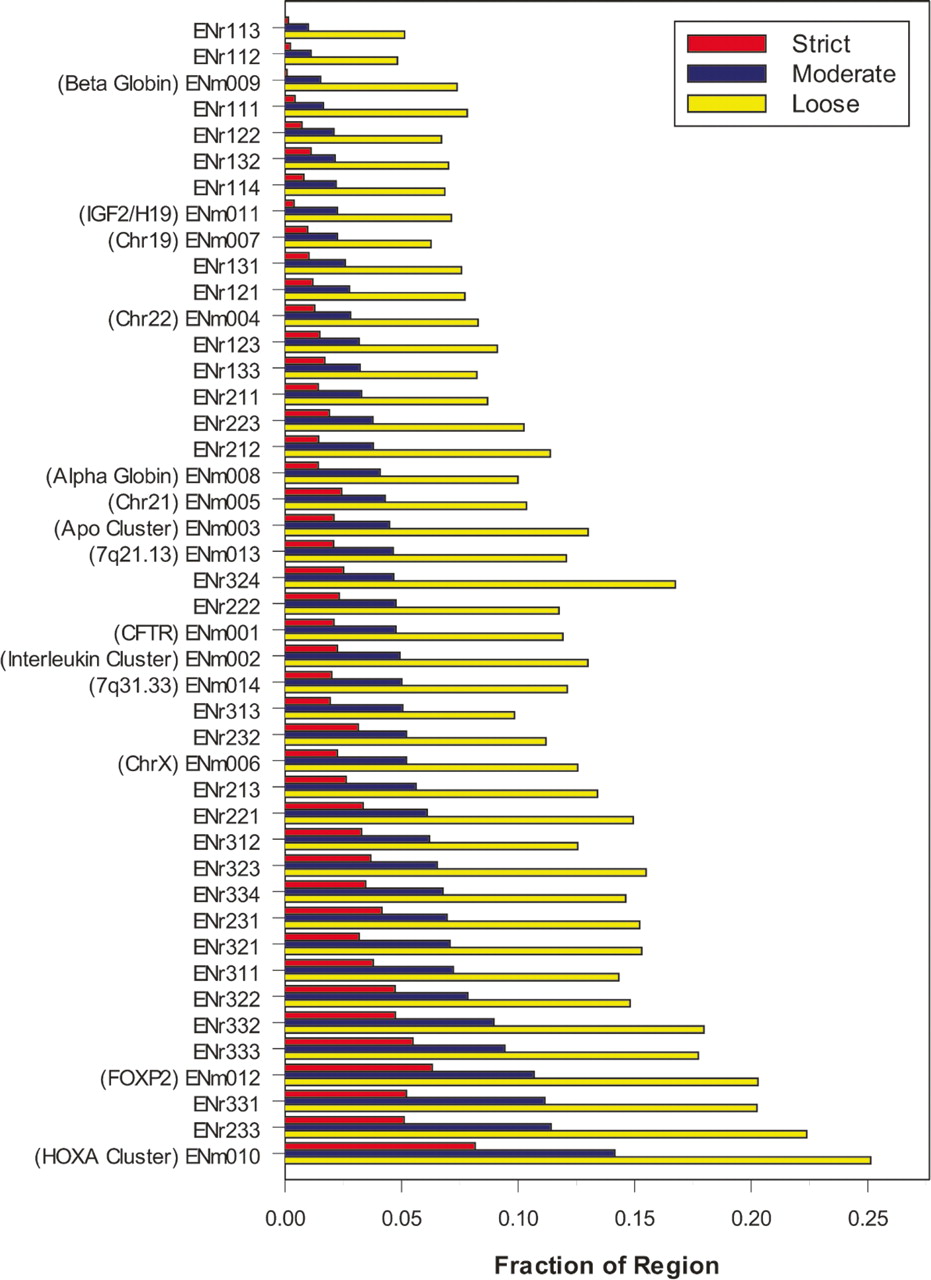
Figure 6.
Constrained bases in each ENCODE region. For each ENCODE region (Y-axis), the percentage of nucleotides found to be under evolutionary constraint in the strict (red), moderate (blue), and loose sets (yellow) is shown (X-axis). The 44 regions are ranked from top to bottom by the fraction of bases in the moderate (green) annotations. For all the manually picked regions, their biological significance is noted in parentheses.


