
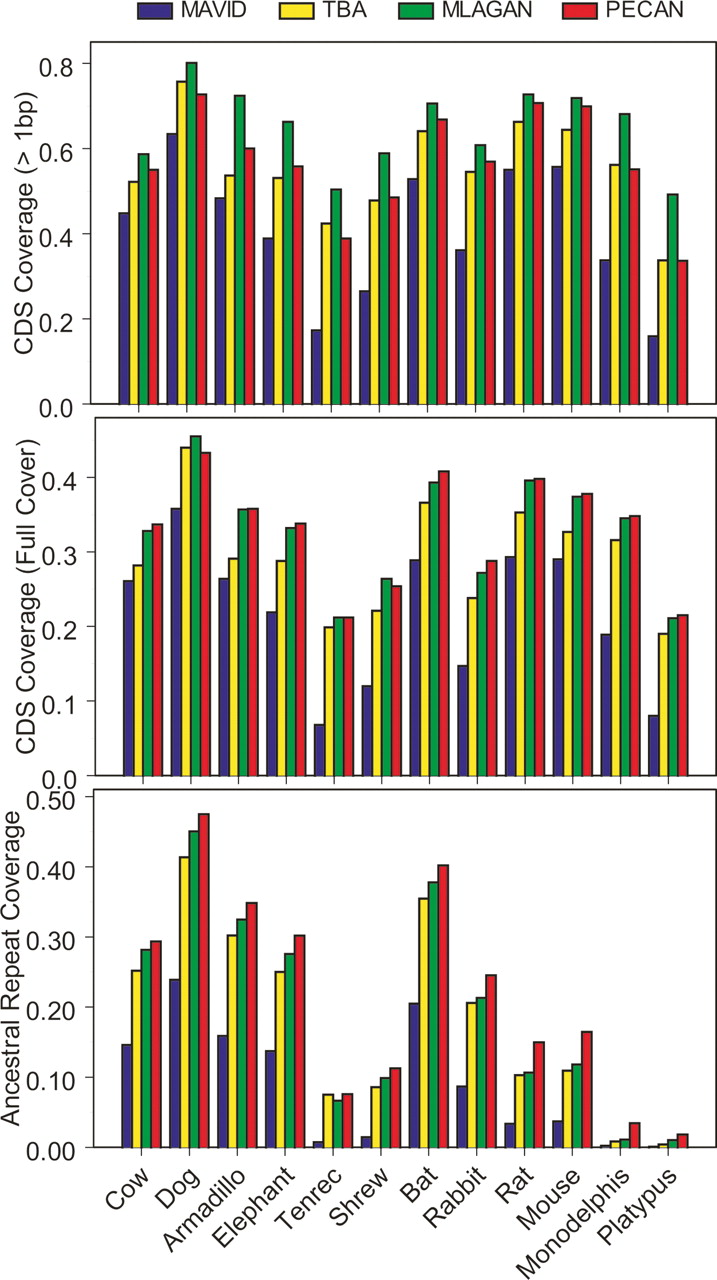
Alignment coverage of coding exons and ancestral repeats. For a representative group of mammalian species (X-axis), the fraction of human coding exons covered by at least 1 base (top panel) or completely covered (i.e., no gaps, middle panel) are shown for the MAVID (blue), TBA (yellow), MLAGAN (green), and PECAN (red) alignments. For the same set of species, we also show the percentage of all human “ancestral repeat” bases (out of a total of ∼5.8 million) that are aligned to a nucleotide within a mobile element of the same class and family. Note that absolute coverage levels should be interpreted cautiously, as they reflect both phylogenetic signal (i.e., insertions and deletions of DNA between human and the query species) and sequence completeness.


