
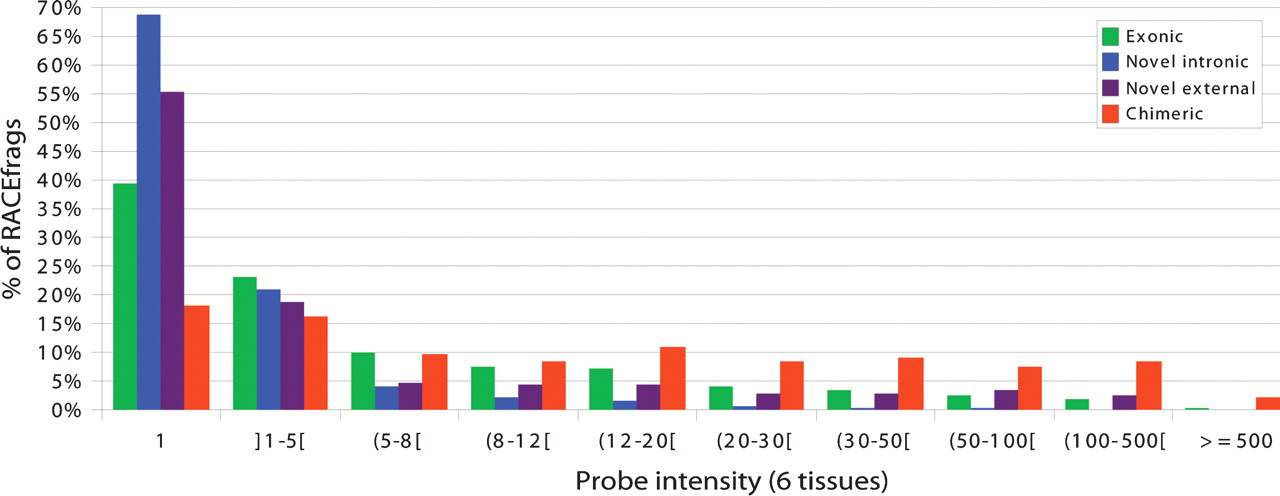
Figure 6.
Intensity signal registered for RACEfrags. Distribution of exonic (green columns), novel intronic (blue columns), novel external (purple columns), and chimeric (red columns) RACEfrags according to the intensity signals measured on probes overlapping the regions where they map in six tissues. Intensity values are represented on the X-axis. Values of 1 mean no signal (ratio of 1 compared with control), as positive probes have intensity >1. The percentage of RACEfrags in each intensity bin is given on the Y-axis.


