
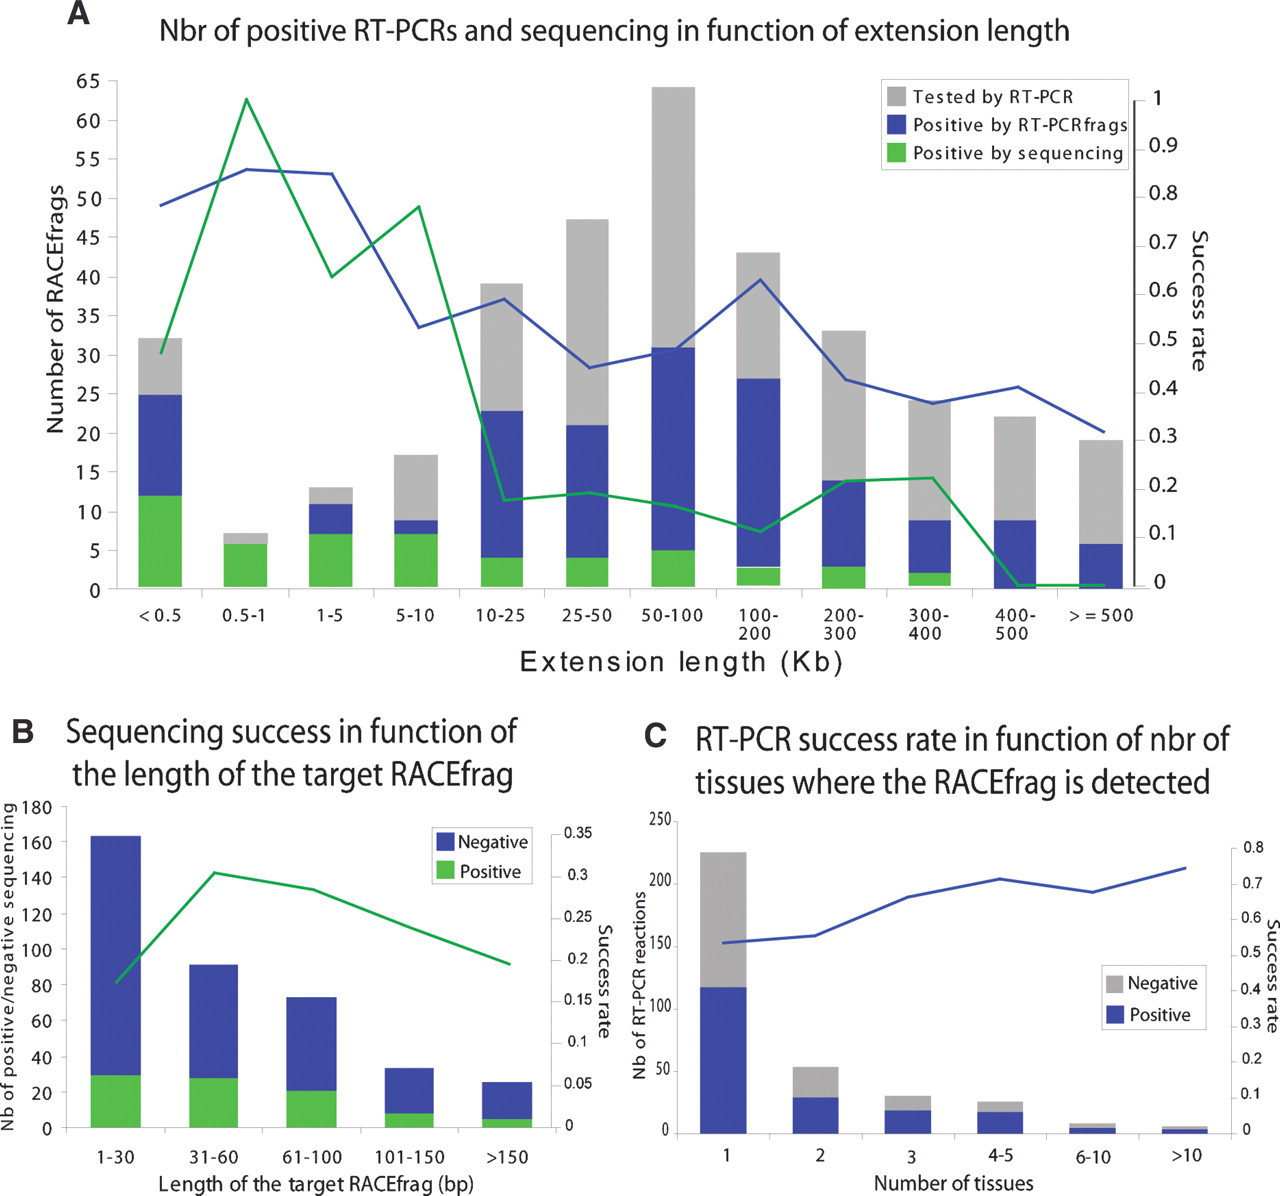
Figure 4.
Characteristics of RACEfrags subjected to RT-PCR, cloning, and sequencing and success rates. Distributions of RACEfrags selected to be independently verified by RT-PCR according to the genomic distance separating them from their index exon (A), their lengths (B), or the number of tissues where they were detected (C). The histograms (Y-axis scale on the left) show the fractions of RACEfrags successfully confirmed only by RT-PCRfrags (blue, see text for details), or by RT-PCRfrags, cloning, and sequencing (green). The curves (Y-axis scale on the right) indicate the success rate by hybridization (blue curve) or by hybridization, cloning, and sequencing (green curve).


