
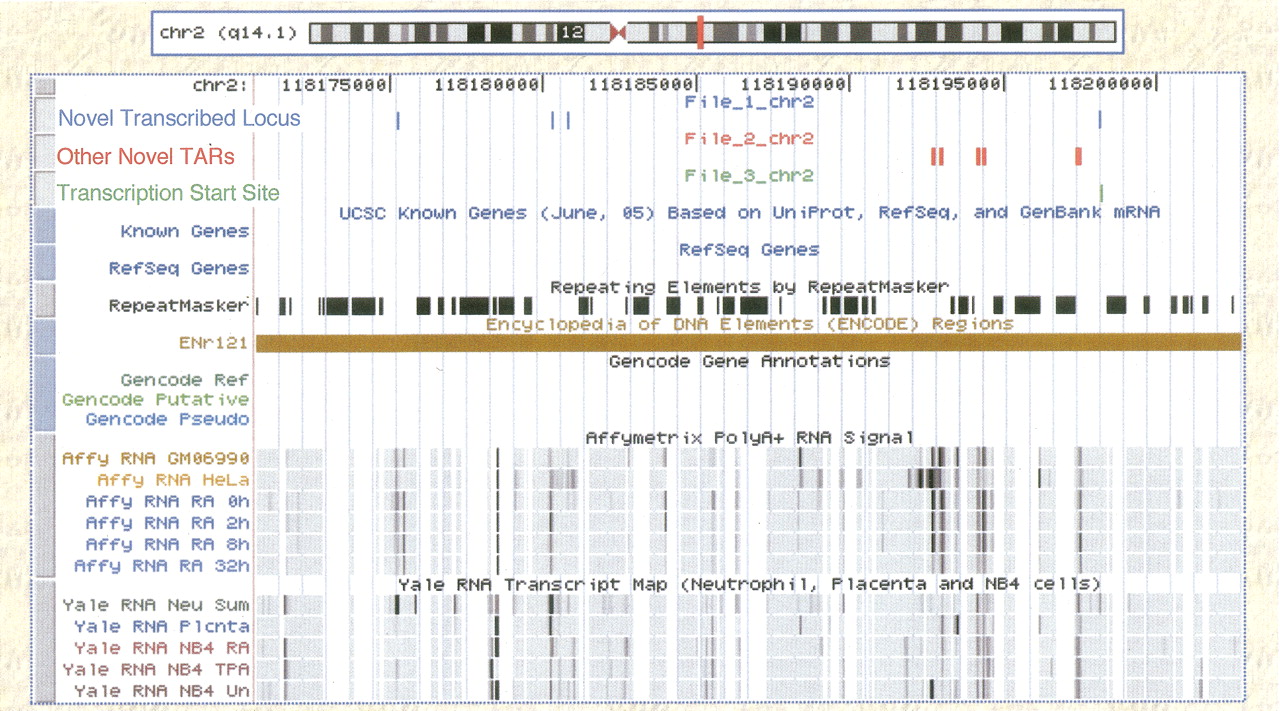
Figure 7.
Plot of a novel transcribed locus identified using the expression profile (the clustered TARs are shown in blue). Other novel TARs that are not part of this cluster are shown in red. In green we see the overlap of a putative transcription start site with the likely 5′ end of this cluster. There are no annotated transcripts in the region displayed (chr 2 from 118,175,232 to 118,198,192, NCBI Build 35). We also observe transcript maps for the 11 different cell lines and conditions (not all novel TARs are shown in this region).


