
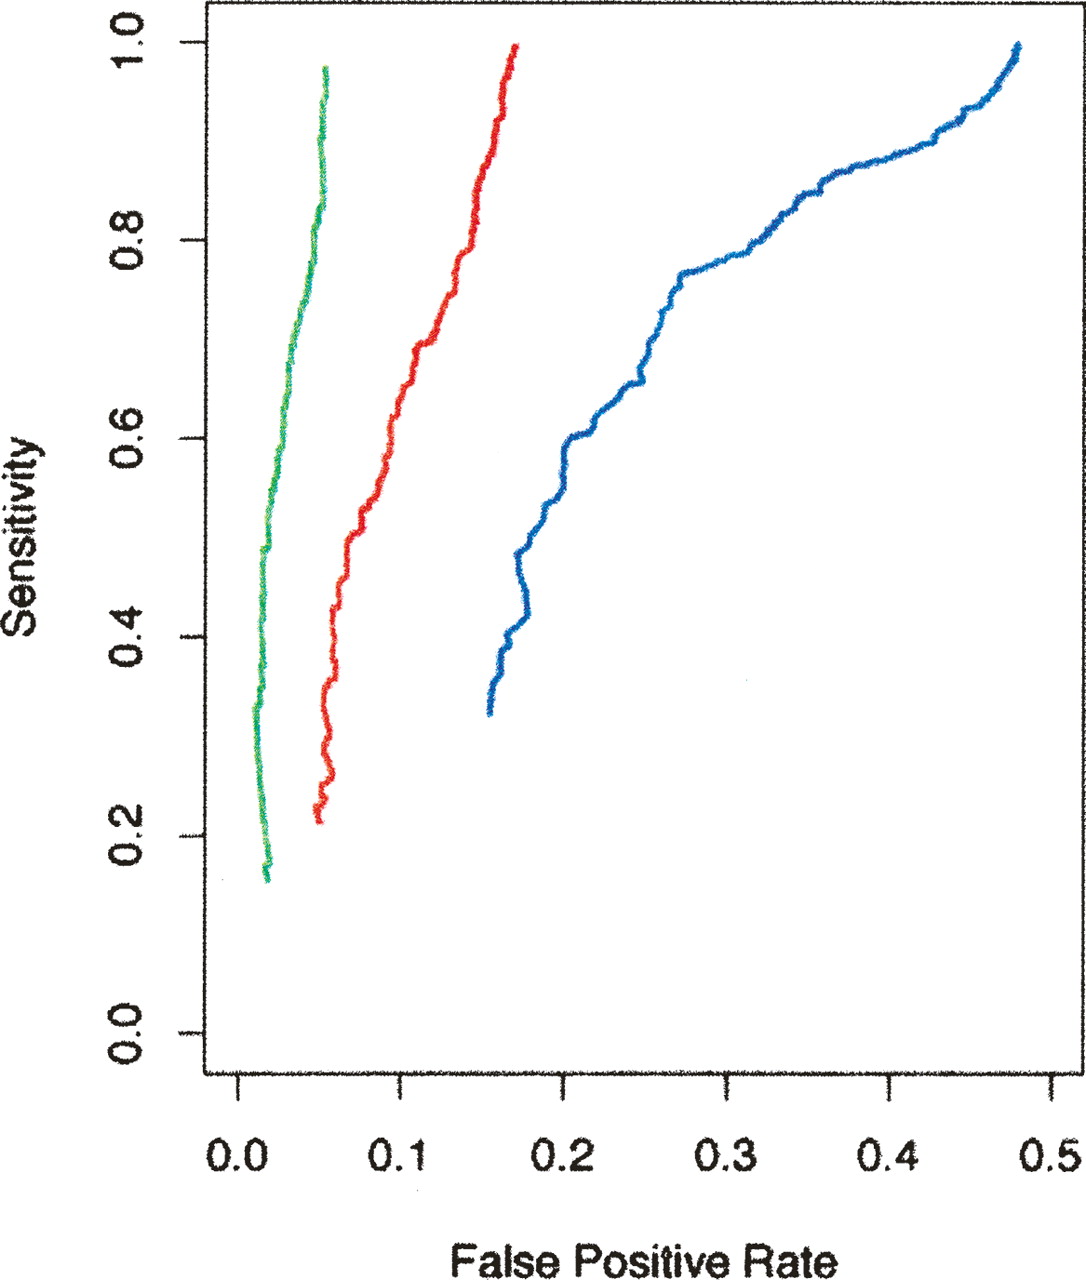
Plot of sensitivity against false-positive rate for the assignment of exons of known genes to the correct gene on the basis of the exon being coexpressed with other exons. The blue curve is calculated where an exon is allowed to be assigned to any gene in the genome, while the red and green curves are where the assignment is limited to genes which have exons within 100 kb and 20 kb of the target exon, respectively. Restricting assignment to exons of nearby genes reduces the false-positive rate of the assignment. The Pearson correlation of the best possible assignment for each exon is the threshold which parameterizes each curve.


