
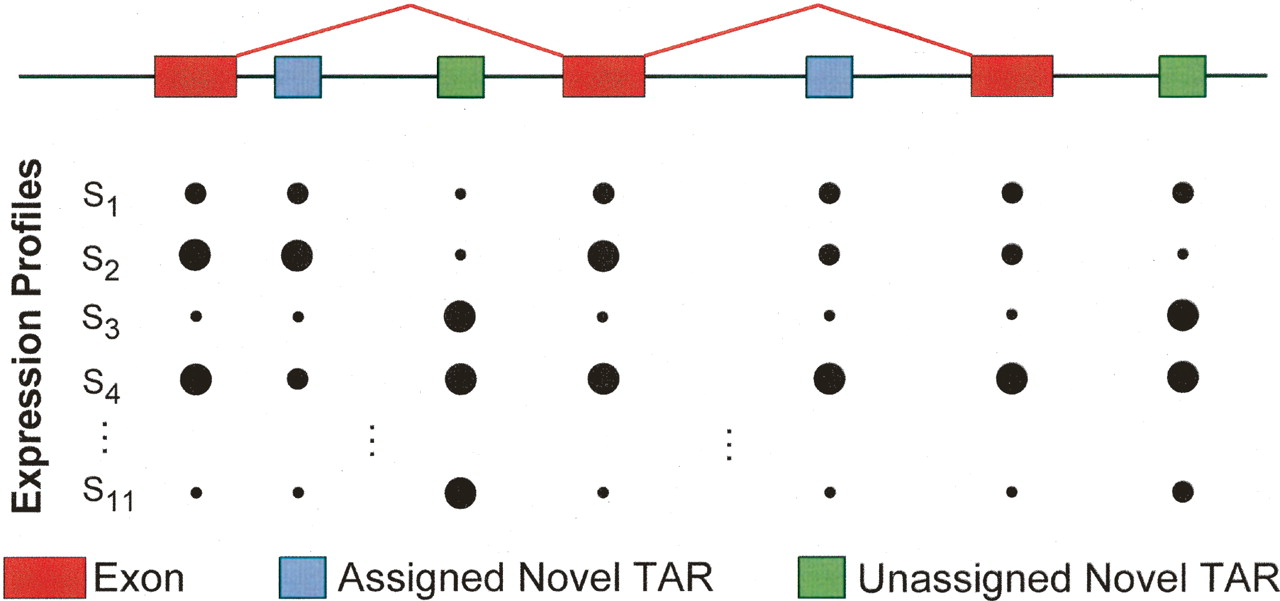
Figure 4.
Illustration showing how novel TARs can be associated with known genes by identifying novel TARs that are coexpressed with exons of known genes. Coexpression is determined by computing the Pearson correlation of expression profiles of array signals between novel TARs and nearby (closer than 20 kb) exons. The sizes of the circles correspond to the fluorescent signal intensity measured on the tiling arrays for each of the 11 different cell lines indicated by S1 through S11.


