
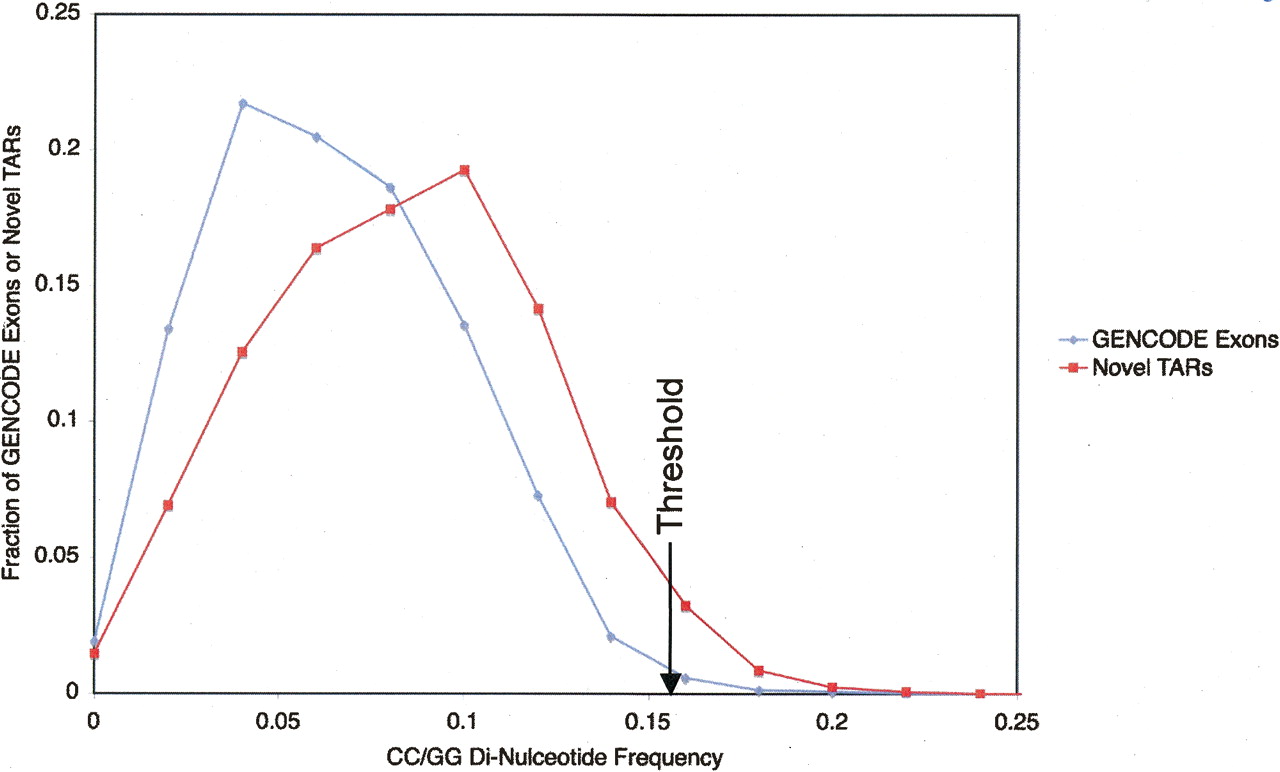
Figure 3.
Plot of the distribution of GENCODE exons (blue line) and novel TARs (red line) against CC/GG di-nucleotide frequency. The distribution of novel TARs is skewed to high CC/GG di-nucleotide frequencies. A black arrow indicates the di-nucleotide frequency (0.155) above which only ∼1% of the GENCODE exons are found. This threshold is used to filter novel TARs with peculiar sequence composition (CC/GG di-nucleotide frequency higher than 0.155).


