
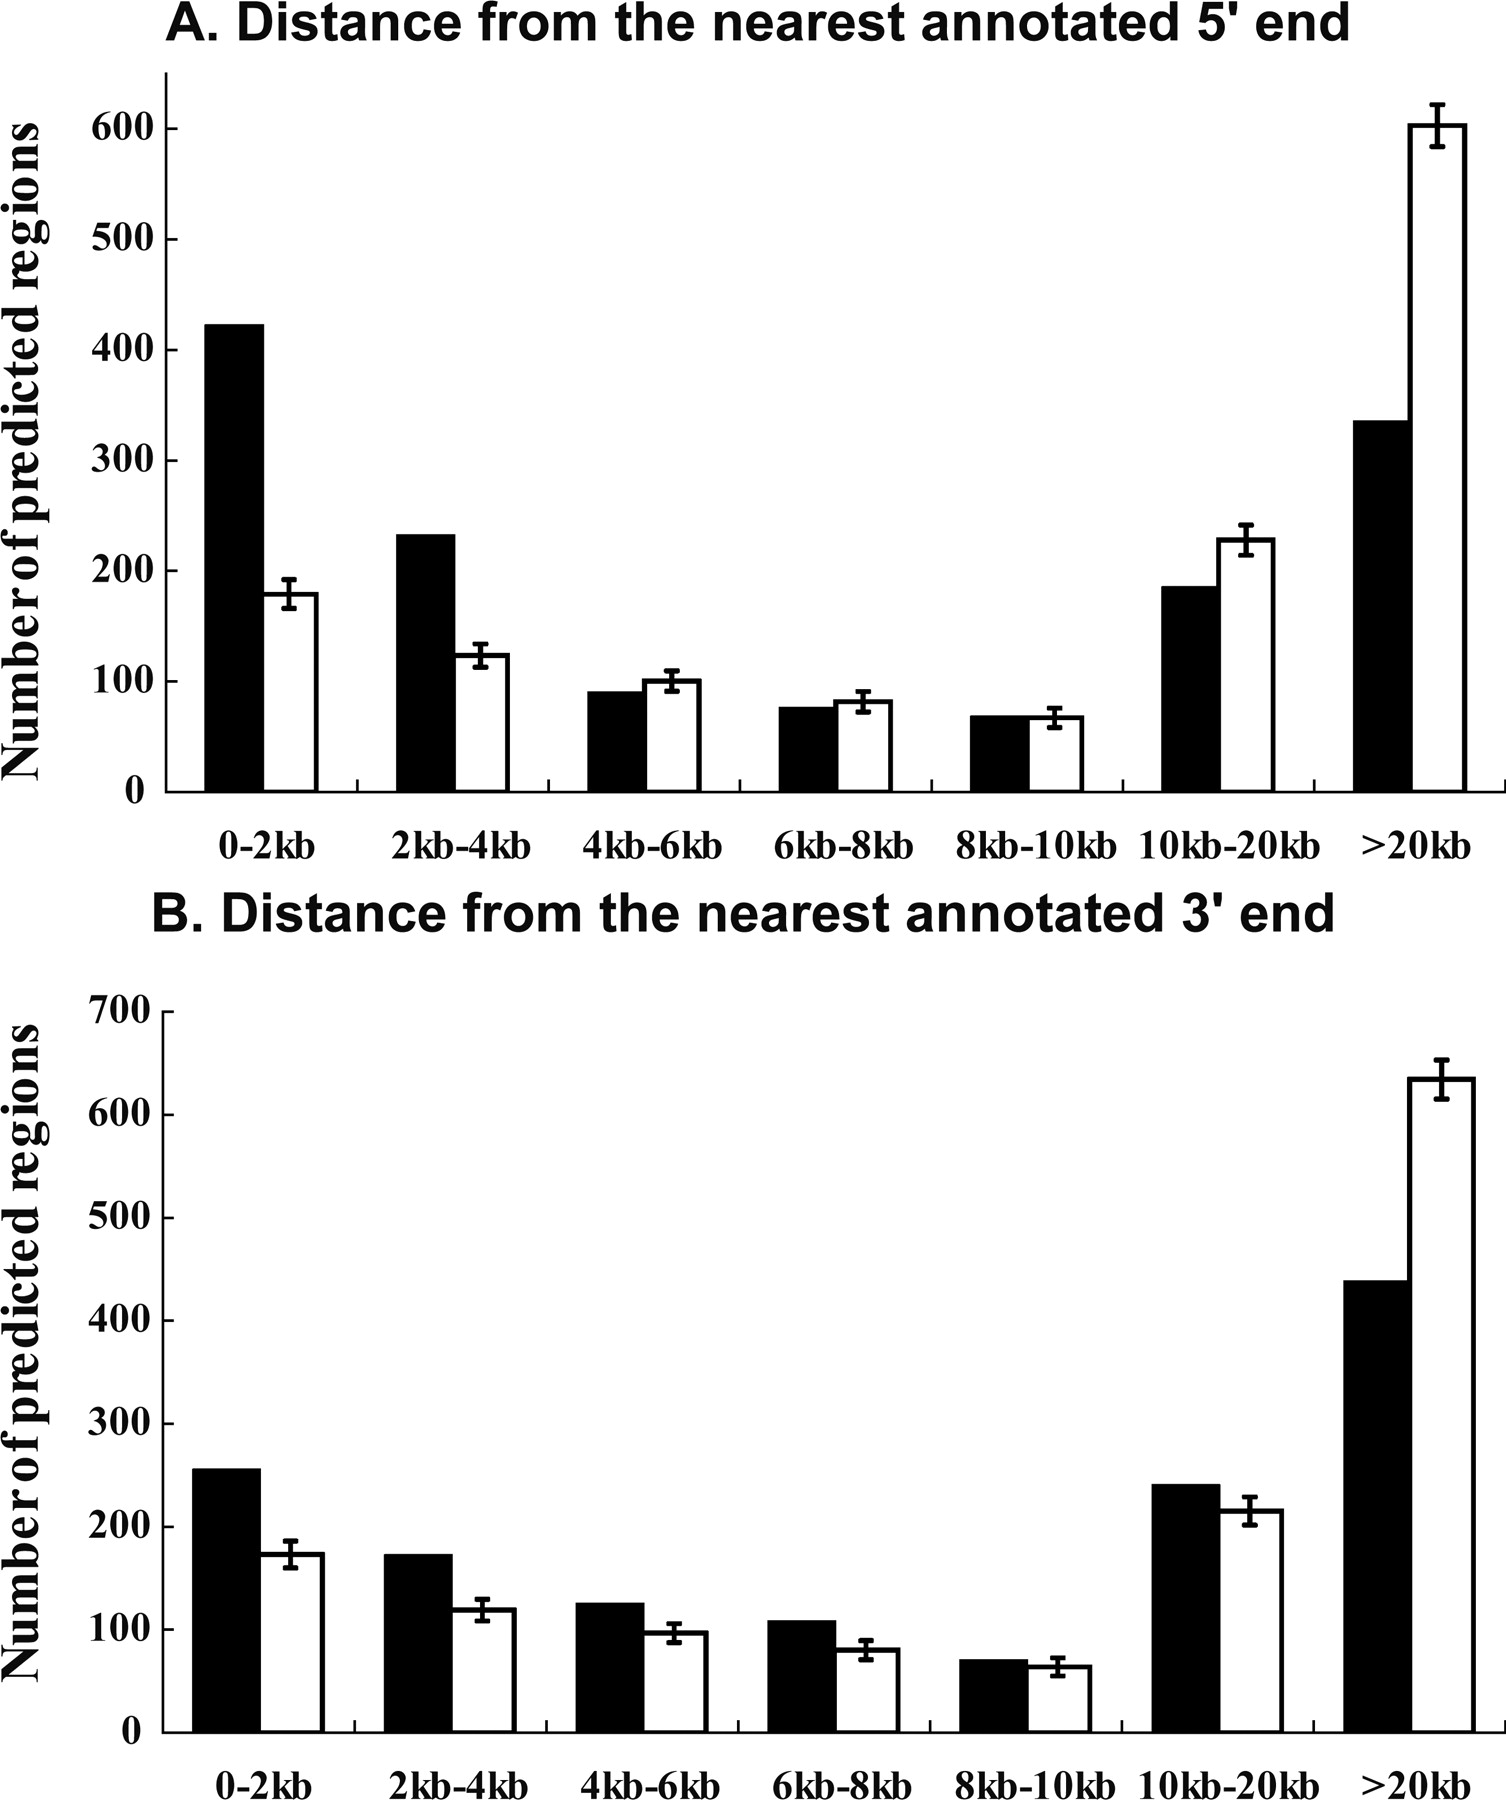
Figure 3.
Distance of predicted regions from annotated transcripts. Black bars indicate the number of regions at various distances from 5′-ends (A) and 3′-ends (B) for all predicted regions. White bars indicate the number of regions expected by a randomization process as used in Figure 2.


