
Table 1.
Regions with different histone acetylation patterns before and after butyrate treatment
Click on table to view larger version.
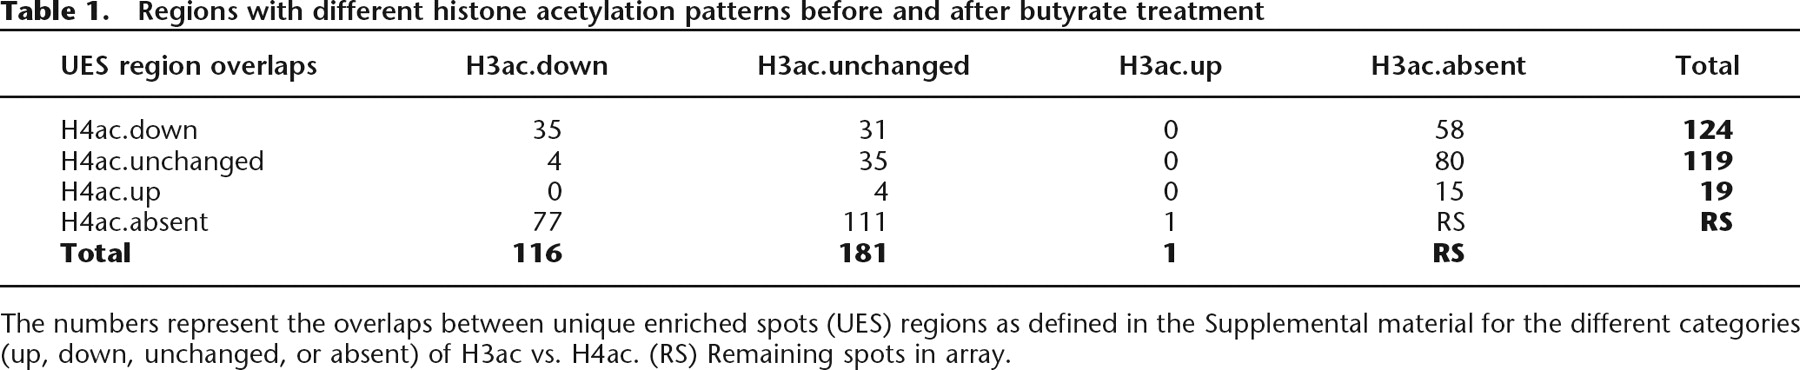
The numbers represent the overlaps between unique enriched spots (UES) regions as defined in the Supplemental material for the different categories (up, down, unchanged, or absent) of H3ac vs. H4ac. (RS) Remaining spots in array.


