
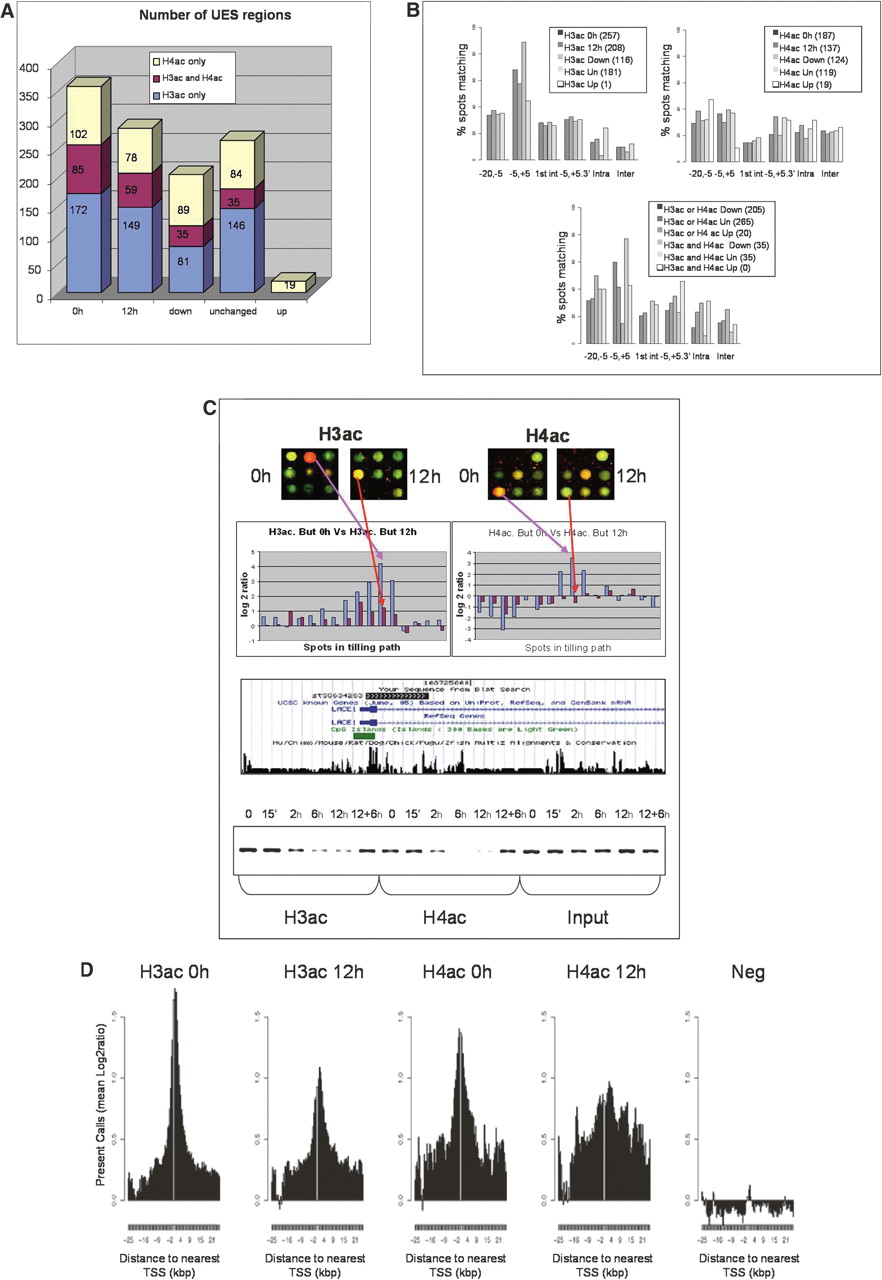
Genome-wide changes in acetylation patterns of histone H3 and H4 in 1% of the genome after butyrate treatment. (A) Number of unique enriched spots (UES, see Supplemental Material and Methods) for H3ac and H4ac, respectively, and overlapping regions at 0 h, 12 h, deacetylated (down), unchanged (Un), and Up groups. (B) Distribution of the different UES respective to their distance to TSS is presented for the 0 h, 12 h, down, unchanged (Un), and up groups either for H3 (left) or H4 (right) alone, or for both histones (bottom). Due to multiple TSSs for unique genes, each UES could map to more than one category, and therefore, total numbers can sum up more than 100%. Distances to TSS or 3′ ends are in Kbp. (1st int) First intron; (Intra) intragenic; (Inter) intergenic. (C) H3ac and H4ac decreased around TSS of LACE1, according to our ChIP-chip experiments (top histograms), which was verified when analyzed by PCR in the same region (bottom). The spots presented in the upper part come from one of the biological replicates in each case, where ChIP DNA was always labeled with Cy5 (red), while input DNA was labeled with Cy3 (green). The log2-ratios in the histograms represent the ratios between the signals for ChIP DNA labeled with Cy5 and the input DNA labeled with Cy3, which have been transformed to log2 values. In such histograms, the blue and red bars correspond to untreated (0 h) and treated (12 h) experiments, respectively. (D) Log2-ratios of acetylated histones and negative control arrays, depicting the spots mapping within 5 kb of Transcription Start Sites (TSS) for UES. For all selected spots a sequence window of ±25 Kb around TSS is presented.


