
Abstract
While sequencing of the human genome surprised us with how many protein-coding genes there are, it did not fundamentally change our perspective on what a gene is. In contrast, the complex patterns of dispersed regulation and pervasive transcription uncovered by the ENCODE project, together with non-genic conservation and the abundance of noncoding RNA genes, have challenged the notion of the gene. To illustrate this, we review the evolution of operational definitions of a gene over the past century—from the abstract elements of heredity of Mendel and Morgan to the present-day ORFs enumerated in the sequence databanks. We then summarize the current ENCODE findings and provide a computational metaphor for the complexity. Finally, we propose a tentative update to the definition of a gene: A gene is a union of genomic sequences encoding a coherent set of potentially overlapping functional products. Our definition sidesteps the complexities of regulation and transcription by removing the former altogether from the definition and arguing that final, functional gene products (rather than intermediate transcripts) should be used to group together entities associated with a single gene. It also manifests how integral the concept of biological function is in defining genes.
Introduction
The classical view of a gene as a discrete element in the genome has been shaken by ENCODE
The ENCODE consortium recently completed its characterization of 1% of the human genome by various high-throughput experimental and computational techniques designed to characterize functional elements (The ENCODE Project Consortium 2007). This project represents a major milestone in the characterization of the human genome, and the current findings show a striking picture of complex molecular activity. While the landmark human genome sequencing surprised many with the small number (relative to simpler organisms) of protein-coding genes that sequence annotators could identify (∼21,000, according to the latest estimate [see www.ensembl.org]), ENCODE highlighted the number and complexity of the RNA transcripts that the genome produces. In this regard, ENCODE has changed our view of “what is a gene” considerably more than the sequencing of the Haemophilus influenza and human genomes did (Fleischmann et al. 1995; Lander et al. 2001; Venter et al. 2001). The discrepancy between our previous protein-centric view of the gene and one that is revealed by the extensive transcriptional activity of the genome prompts us to reconsider now what a gene is. Here, we review how the concept of the gene has changed over the past century, summarize the current thinking based on the latest ENCODE findings, and propose a new updated gene definition that takes these findings into account.
History of the gene, 1860 to just before ENCODE
Definition 1860s–1900s: Gene as a discrete unit of heredity
The concept of the “gene” has evolved and become more complex since it was first proposed (see timeline in attached Figure 1, accompanying poster). There are various definitions of the term, although common initial descriptions include the ability to determine a particular characteristic of an organism and the heritability of this characteristic. In particular, the word gene was first used by Wilhelm Johannsen in 1909, based on the concept developed by Gregor Mendel in 1866 (Mendel 1866). The word was a derivative of pangene, which was used by Hugo De Vries for entities involved in pangenesis, Darwin’s hypothetical mechanism of heredity (Heimans 1962). Johnannsen called a gene the “special conditions, foundations and determiners which are present [in the gametes] in unique, separate and thereby independent ways [by which] many characteristics of the organism are specified” (Johannsen 1909, p. 124). The etymology of the term derives from the Greek genesis (“birth”) or genos (“origin”). The related word genetics was used by the geneticist William Bateson in 1905 (http://www.jic.ac.uk/corporate/about/bateson.htm).
Mendel showed that when breeding plants, some traits such as height or flower color do not appear blended in their offspring—that is, these traits are passed on as distinct, discrete entities (Mendel 1866). His work also demonstrated that variations in traits were caused by variations in inheritable factors (or, in today’s terminology, phenotype is caused by genotype). It was only after Mendel’s work was repeated and rediscovered by Carl Correns, Erich von Tschermak-Seysenegg, and Hugo De Vries in 1900 that further work on the nature of the unit of inheritance truly began (Tschermak 1900; Vries 1900; Rheinberger 1995).
Definition 1910s: Gene as a distinct locus
In the next major development, the American geneticist Thomas Hunt Morgan and his students were studying the segregation of mutations in Drosophila melanogaster. They were able to explain their data with a model that genes are arranged linearly, and their ability to cross-over is proportional to the distance that separated them. The first genetic map was created in 1913 (Sturtevant 1913), and Morgan and his students published The Mechanism of Mendelian Inheritance in 1915 (Morgan et al. 1915). To the early geneticists, a gene was an abstract entity whose existence was reflected in the way phenotypes were transmitted between generations. The methodology used by early geneticists involved mutations and recombination, so the gene was essentially a locus whose size was determined by mutations that inactivated (or activated) a trait of interest and by the size of the recombining regions. The fact that genetic linkage corresponded to physical locations on chromosomes was shown later, in 1929, by Barbara McClintock, in her cytogenetic studies on maize (McClintock 1929).
Definition 1940s: Gene as a blueprint for a protein
Beadle and Tatum (1941), who studied Neurospora metabolism, discovered that mutations in genes could cause defects in steps in metabolic pathways. This was stated as the “one gene, one enzyme” view, which later became “one gene, one polypeptide.” In this viewpoint, the gene is being implicitly considered as the information behind the individual molecules in a biochemical pathway. This view became progressively more explicit and mechanistic in later decades.
Definition 1950s: Gene as a physical molecule
The fact that heredity has a physical, molecular basis was demonstrated by the observation that X rays could cause mutations (Muller 1927). Griffith’s (1928) demonstration that something in virulent but dead Pneumococcus strains could be taken up by live nonvirulent Pneumococcus and transform them into virulent bacteria was further evidence in this direction. It was later shown that this substance could be destroyed by the enzyme DNase (Avery et al. 1944). In 1955, Hershey and Chase established that the substance actually transmitted by bacteriophage to their progeny is DNA and not protein (Hershey and Chase 1955). Moreover, the idea that a gene’s product is a diffusible substance underlies the complementation test that was used to define genes in the early years of bacteriology. A practical view of the gene was that of the cistron, a region of DNA defined by mutations that in trans could not genetically complement each other (Benzer 1955).
Definition 1960s: Gene as transcribed code
It was the solution of the three-dimensional structure of DNA by Watson and Crick in 1953 (Watson and Crick 1953) that explained how DNA could function as the molecule of heredity. Base pairing explained how genetic information could be copied, and the existence of two strands explained how occasional errors in replication could lead to a mutation in one of the daughter copies of the DNA molecule.
From the 1960s on, molecular biology developed at a rapid pace. The RNA transcript of the protein-coding sequences was translated using the genetic code (solved in 1965 by Nirenberg et al. [1965 and Söll et al. [1965) into an amino acid sequence. Francis Crick (1958) summarized the flow of information in gene expression as from nucleic acid to protein (the beginnings of the “Central Dogma”). However, there were some immediate exceptions to this: It was known that some genes code not for protein but for functional RNA molecules such as rRNA and tRNA. In addition, in RNA viruses the gene is made of RNA. The molecular view of the gene that developed through the 1960s can be summarized in general terms to be a code residing on nucleic acid that gives rise to a functional product.
Definition 1970s–1980s: Gene as open reading frame (ORF) sequence pattern
The development of cloning and sequencing techniques in the 1970s, combined with knowledge of the genetic code, revolutionized the field of molecular biology by providing a wealth of information on how genes are organized and expressed. The first gene to be sequenced was from the bacteriophage MS2, which was also the first organism to be fully sequenced (Fiers et al. 1971, 1976). The parallel development of computational tools led to algorithms for the identification of genes based on their sequence characteristics (e.g., for review, see Rogic et al. 2001). In many cases, a DNA sequence could be used to infer structure and function for the gene and its products. This situation created a new concept of the “nominal gene,” which is defined by its predicted sequence rather than as a genetic locus responsible for a phenotype (Griffiths and Stotz 2006). The identification of most genes in sequenced genomes is based either on their similarity to other known genes, or the statistically significant signature of a protein-coding sequence. In many cases, the gene effectively became identified as an annotated ORF in the genome (Doolittle 1986).
Definition 1990s–2000s: Annotated genomic entity, enumerated in the databanks (current view, pre-ENCODE)
The current definition of a gene used by scientific organizations that annotate genomes still relies on the sequence view. Thus, a gene was defined by the Human Genome Nomenclature Organization as “a DNA segment that contributes to phenotype/function. In the absence of demonstrated function a gene may be characterized by sequence, transcription or homology” (Wain et al. 2002). Recently, the Sequence Ontology Consortium reportedly called the gene a “locatable region of genomic sequence, corresponding to a unit of inheritance, which is associated with regulatory regions, transcribed regions and/or other functional sequence regions” (Pearson 2006).
The sequencing of first the Haemophilus influenza genome and then the human genome (Fleischmann et al. 1995; Lander et al. 2001; Venter et al. 2001) led to an explosion in the amount of sequence that definitions such as the above could be applied to. In fact, there was a huge popular interest in counting the number of genes in various organisms. This interest was crystallized originally by Gene Sweepstake’s wager on the number of genes in the human genome, which received extensive media coverage (Wade 2003).
It has been pointed out that these enumerations overemphasize traditional, protein-coding genes. In particular, when the number of genes present in the human genome was reported in 2003, it was acknowledged that too little was known about RNA-coding genes, such that the given number was that of protein-coding genes. The Ensembl view of the gene was specifically summarized in the rules of the Gene Sweepstake as follows: “alternatively spliced transcripts all belong to the same gene, even if the proteins that are produced are different.” (http://web.archive.org/web/20050627080719/www.ensembl.org/Genesweep/).
A current computational metaphor: Genes as “subroutines” in the genomic operating system
Given that counting genes in the genome is such a large-scale computational endeavor and that genes fundamentally deal with information processing, the lexicon of computer science naturally has been increasingly applied to describing them. In particular, people in the computational biology community have used the description of a formal language to describe the structure of genes in very much the same way that grammars are used to describe computer programs—with a precise syntax of upstream regulation, exons, and introns (Searls 1997, 2001, 2002). Moreover, one metaphor that is increasingly popular for describing genes is to think of them in terms of subroutines in a huge operating system (OS). That is, insofar as the nucleotides of the genome are put together into a code that is executed through the process of transcription and translation, the genome can be thought of as an operating system for a living being. Genes are then individual subroutines in this overall system that are repetitively called in the process of transcription.
Problematic issues with the current definition of a gene
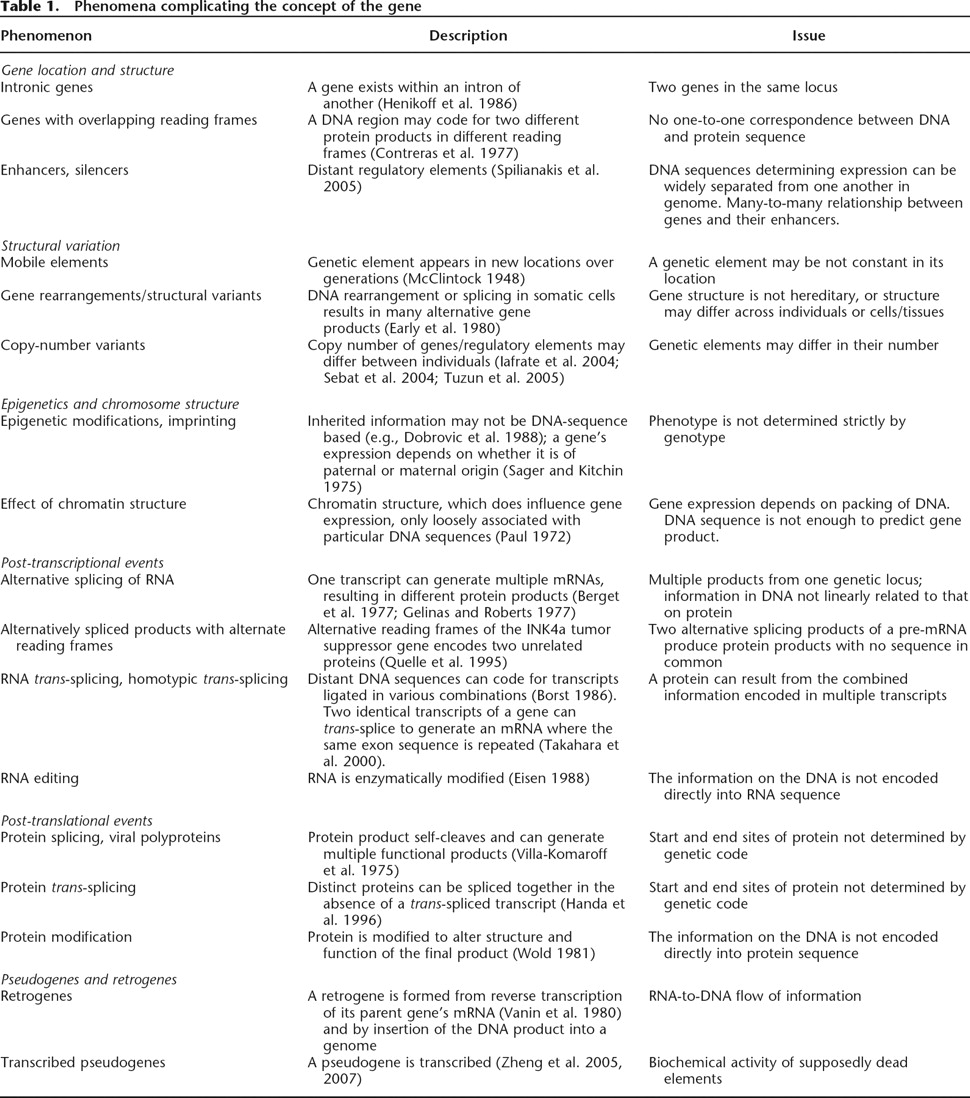
There are a number of problematic aspects of the current definition of a gene, as applied to the human genome, which we discuss below. Several additional complications are summarized in Table 1.
Phenomena complicating the concept of the gene
1. Gene regulation
Jacob and Monod (1961), in their study of the lac operon of Escherichia coli, provided a paradigm for the mechanism of regulation of the gene: It consisted of a region of DNA consisting of sequences coding for one or more proteins, a “promoter” sequence for the binding of RNA polymerase, and an “operator” sequence to which regulatory genes bind. Later, other sequences were found to exist that could affect practically every aspect of gene regulation from transcription to mRNA degradation and post-translational modification. Such sequences could reside within the coding sequence as well as in the flanking regions, and in the case of enhancers and related elements, very far away from the coding sequence. Although functionally required for the expression of the gene product, regulatory elements, especially the distant ones, made the concept of the gene as a compact genetic locus problematic.
Regulation is integral to many current definitions of the gene. In particular, one current textbook definition of a gene in molecular terms is the entire nucleic acid sequence that is necessary for the synthesis of a functional polypeptide (or RNA) (Lodish et al. 2000). If that implies appropriately regulated synthesis, the DNA sequences in a gene would include not only those coding for the pre-mRNA and its flanking control regions, but also enhancers. Moreover, many enhancers are distant along the DNA sequence, although they are actually quite close due to three-dimensional chromatin structure.
2. Overlapping and spliced genes
Overlapping
As genes, mRNAs, and eventually complete genomes were sequenced, the simple operon model turned out to be applicable only to genes of prokaryotes and their phages. Eukaryotes were different in many respects, including genetic organization and information flow. The model of genes as hereditary units that are nonoverlapping and continuous was shown to be incorrect by the precise mapping of the coding sequences of genes. In fact, some genes have been found to overlap one another, sharing the same DNA sequence in a different reading frame or on the opposite strand. The discontinuous structure of genes potentially allows one gene to be completely contained inside another one’s intron, or one gene to overlap with another on the same strand without sharing any exons or regulatory elements.
Splicing
Splicing was discovered in 1977 (Berget et al. 1977; Chow et al. 1977; Gelinas and Roberts 1977). It soon became clear that the gene was not a simple unit of heredity or function, but rather a series of exons, coding for, in some cases, discrete protein domains, and separated by long noncoding stretches called introns. With alternative splicing, one genetic locus could code for multiple different mRNA transcripts. This discovery complicated the concept of the gene radically. For instance, in the sequencing of the genome, Celera defined a gene as “a locus of co-transcribed exons” (Venter et al. 2001), and Ensembl’s Gene Sweepstake Web page originally defined a gene as “a set of connected transcripts,” where “connected” meant sharing one exon (http://web.archive.org/web/20050428090317/www.ensembl.org/Genesweep). The latter definition implies that a group of transcripts may share a set of exons, but no one exon is common to all of them.
Trans-splicing
The phenomenon of trans-splicing (ligation of two separate mRNA molecules) further complicated our understanding (Blumenthal 2005). There are examples of transcripts from the same gene, or the opposite DNA strand, or even another chromosome, being joined before being spliced. Clearly, the classical concept of the gene as “a locus” no longer applies for these gene products whose DNA sequences are widely separated across the genome. Finally, a number of recent studies have highlighted a phenomenon dubbed tandem chimerism, where two consecutive genes are transcribed into a single RNA (Akiva et al. 2006; Parra et al. 2006). The translation (after splicing) of such RNAs can lead to a new, fused protein, having parts from both original proteins.
3. Parasitic and mobile genes
A challenge to our concept of the gene has been that of the selfish or parasitic gene. The idea first proposed by Richard Dawkins is that the unit of evolution is not the organism but the gene (Dawkins 1976). Organisms are just tools that genes use to replicate themselves. Dawkins’ concept of the optimon (or selecton) is a unit of DNA that survives recombination for enough generations to be selected for together.
The term parasitic certainly appears appropriate for transposons, whose only function is to replicate themselves and which do not provide any obvious benefit to the organism. Transposons can change their locations in addition to copying themselves by excision, recombination, or reverse transcription. They were first discovered in the 1930s in maize and were later found to exist in all branches of life, including humans (McClintock 1948). Transposons have altered our view of the gene by demonstrating that a gene is not fixed in its location.
4. The large amount of “junk DNA” under selection
The “ORF sequence pattern concept” of the gene as it existed from the 1980s onward made it clear that there were large expanses of nongenic elements in eukaryotic genomes, particularly the human genome. In the absence of knowledge of a function for these regions, it was proposed that they lacked a function by some who used the label of “junk DNA” (Ohno 1972). This was underscored by the subsequent sequencing of the human genome, where it was shown that only 1.2% of the DNA bases code for exons (Lander et al. 2001; Venter et al. 2001). However, some early pilot functional genomics experiments on chromosomes 21 and 22 indicated that appreciable amounts of the supposedly junk DNA were transcribed (Kapranov et al. 2002; Rinn et al. 2003). Moreover, comparison of the human, dog, mouse, and other vertebrate genomes showed that a large fraction of these was conserved, with ∼5% under negative selection since the divergence of these species (Waterston et al. 2002; Lindblad-Toh et al. 2005).
The modern ENCODE view of dispersed genome activity
As described above, before the advent of the ENCODE project, there were a number of aspects of genes that were very complicated, but much of this complexity was in some sense swept under the rug and did not really affect the fundamental definition of a gene. The experience of the ENCODE project, particularly the mapping of transcriptional activity and regulation using tiling arrays, has extended these puzzling and confusing aspects of genes, bringing them to the forefront, where one has to grapple more directly with them in relation to the definition of what a gene is.
What the ENCODE experiments show: Lattices of long transcripts and dispersed regulation
Unannotated transcription
A first finding from the ENCODE consortium that has reproduced earlier results (Bertone et al. 2004; Cheng et al. 2005) is that a vast amount of DNA, not annotated as known genes, is transcribed into RNA (The ENCODE Project Consortium 2007). These novel transcribed regions are usually called TARs (i.e., transcriptionally active regions) and transfrags. While the majority of the genome appears to be transcribed at the level of primary transcripts, only about half of the processed (spliced) transcription detected across all the cell lines and conditions mapped is currently annotated as genes.
Unannotated and alternative TSSs
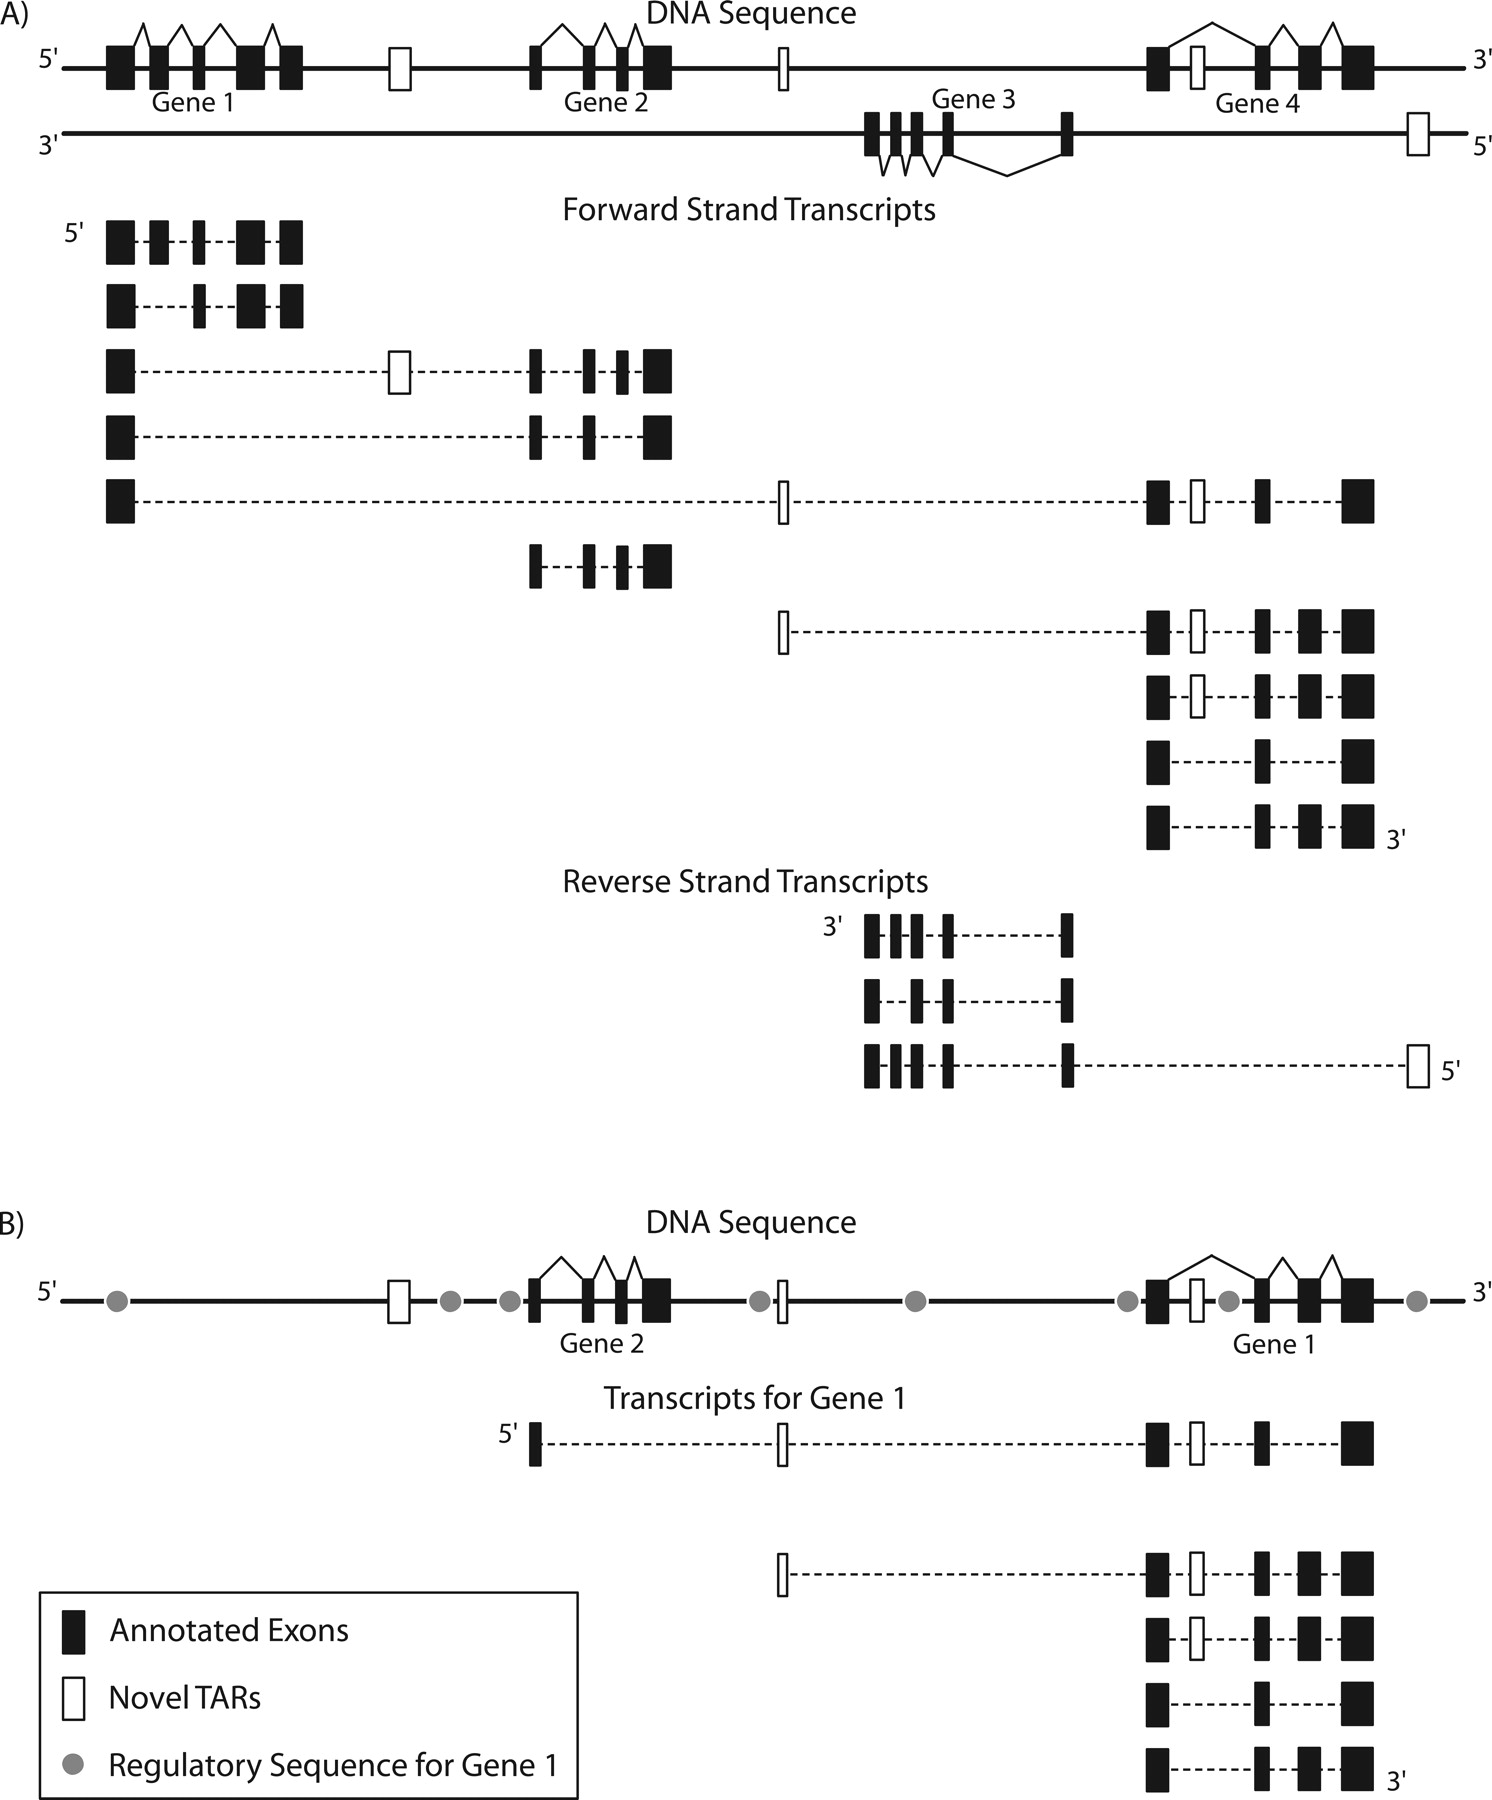
A second observation is that there are a large number of unannotated transcription start sites (TSSs) identified by either sequencing of the 5′ end of transcribed mRNAs or the mapping of promoter-associated transcription factors via ChIP–chip or ChIP–PET (The ENCODE Project Consortium 2007). Furthermore, the consortium found that many known protein genes have alternative TSSs that are sometimes >100 kb upstream of the annotated transcription start site. In particular, Denoeud et al. (2007) performed 5′ rapid amplification of cDNA ends (RACE) on all 399 well-characterized protein-coding loci contained in the ENCODE regions. The RACE primer was selected from a 5′ exon that was shared among most annotated transcripts from each locus, and the RACE products were hybridized to arrays and mapped. They found that more than half of the loci had an alternative transcription start site upstream of the known site in at least one of the 12 tissues tested. Some of these distal TSSs used the promoter of an entirely different gene locus (i.e., they share the same transcription start site). The significance of this discovery is that the alternative TSS for some of these transcripts started two or three gene loci upstream of the locus from which the RACE primer was selected. Thus, some alternative isoforms are transcripts that span multiple gene loci. (A cartoon schematic is shown in Fig. 2.) Many of the alternative isoforms code for the same protein differing only in their 5′ untranslated regions (UTRs).
Biological complexity revealed by ENCODE. (A) Representation of a typical genomic region portraying the complexity of transcripts in the genome. (Top) DNA sequence with annotated exons of genes (black rectangles) and novel TARs (hollow rectangles). (Bottom) The various transcripts that arise from the region from both the forward and reverse strands. (Dashed lines) Spliced-out introns. Conventional gene annotation would account for only a portion of the transcripts coming from the four genes in the region (indicated). Data from the ENCODE project reveal that many transcripts are present that span across multiple gene loci, some using distal 5′ transcription start sites. (B) Representation of the various regulatory sequences identified for a target gene. For Gene 1 we show all the component transcripts, including many novel isoforms, in addition to all the sequences identified to regulate Gene 1 (gray circles). We observe that some of the enhancer sequences are actually promoters for novel splice isoforms. Additionally, some of the regulatory sequences for Gene 1 might actually be closer to another gene, and the target would be misidentified if chosen purely based on proximity.
More alternative splicing
Taking these findings into account, the Havana team at the Sanger Institute produced the well-curated GENCODE annotation (Harrow et al. 2006). They have not found that the number of known protein-coding gene loci has increased significantly over time. Conversely, the number of annotated alternative isoforms per locus has increased. (The GENCODE annotation currently contains on average 5.4 transcripts per locus). Thus, while part of the large amount of new, unannotated transcription could correspond to entirely new protein-coding gene loci, most of it is likely to correspond to segments of unannotated alternatively spliced transcripts involving known gene loci or to entirely novel noncoding RNAs.
Dispersed regulation
As schematized in Figure 2B, the ENCODE project has provided evidence for dispersed regulation spread throughout the genome (The ENCODE Project Consortium 2007). Moreover, the regulatory sites for a given gene are not necessarily directly upstream of it and can, in fact, be located far away on the chromosome, closer to another gene. While the binding of many transcription factors appears to blanket the entire genome, it is not arranged according to simple random expectations and tends to be clumped into regulatory rich “forests” and poor “deserts” (Zhang et al. 2007).
Moreover, it appears that some of regulatory elements may actually themselves be transcribed. In a conventional and concise gene model, a DNA element (e.g., promoter, enhancer, and insulator) regulating gene expression is not transcribed and thus is not part of a gene’s transcript. However, many early studies have discovered in specific cases that regulatory elements can reside in transcribed regions, such as the lac operator (Jacob and Monod 1961), an enhancer for regulating the beta-globin gene (Tuan et al. 1989), and the DNA binding site of YY1 factor (Shi et al. 1991). The ENCODE project and other recent ChIP–chip experiments have provided large-scale evidence that the concise gene model may be too simple, and many regulatory elements actually reside within the first exon, introns, or the entire body of a gene (Cawley et al. 2004; Euskirchen et al. 2004; Kim et al. 2005; The ENCODE Project Consortium 2007; Zhang et al. 2007).
Genic versus intergenic: Is there a distinction?
Overall, the ENCODE experiments have revealed a rich tapestry of transcription involving alternative splicing, covering the genome in a complex lattice of transcripts. According to traditional definitions, genes are unitary regions of DNA sequence, separated from each other. ENCODE reveals that if one attempts to define a gene on the basis of shared overlapping transcripts, then many annotated distinct gene loci coalesce into bigger genomic regions. One obvious implication of the ENCODE results is that there is less of a distinction to be made between genic and intergenic regions. Genes now appear to extend into what was once called intergenic space, with newly discovered transcripts originating from additional regulatory sites. Moreover, there is much activity between annotated genes in the intergenic space. Two well-characterized sources can contribute to this, transcribed non-protein-coding RNAs (ncRNAs) and transcribed pseudogenes, and an appreciable fraction of these transcribed elements are under evolutionary constraint. A number of these transcribed pseudogenes and ncRNA genes are, in fact, located within introns of protein-coding genes. One cannot simply ignore these components within introns because some of them may influence the expression of their host genes, either directly or indirectly.
Noncoding RNAs
The roles of ncRNA genes are quite diverse, including gene regulation (e.g., miRNAs), RNA processing (e.g., snoRNAs), and protein synthesis (tRNAs and rRNA) (Eddy 2001; Mattick and Makunin 2006). Due to the lack of codons and thus open reading frames, ncRNA genes are hard to identify, and thus probably only a fraction of the functional ncRNAs in humans is known to date, with the exception of the ones with the strongest evolutionary and/or structural constraints, which can be identified computationally through RNA folding and coevolution analyses (e.g., miRNAs that display characteristic hairpin-shaped precursor structures, or ncRNAs in ribonucleoprotein complexes that in combination with peptides form specific secondary structures) (Washietl et al. 2005, 2007; Pedersen et al. 2006). However, the example of the 17-kb large XIST gene involved in dosage compensation shows that functional ncRNAs can expand significantly beyond constrained, computationally identifiable regions (Chureau et al. 2002; Duret et al. 2006).
It is also possible that the RNA products themselves do not have a function, but rather reflect or are important for a particular cellular process. For example, transcription of a regulatory region might be important for chromatin accessibility for transcription factor binding or for DNA replication. Such transcription has been found in the locus control region (LCR) of the beta-globin locus, and polymerase activity has been suggested to be important for DNA replication in E. coli. Alternatively, transcription might reflect nonspecific activity of a particular region, for example, the recruitment of polymerase to regulatory sites. In either of these scenarios, the transcripts themselves would lack a function and be unlikely to be conserved.
Pseudogenes
Pseudogenes are yet another group of “mysterious” genomic components that are often found in introns of genes or in intergenic space (Torrents et al. 2003; Zhang et al. 2003). They are derived from functional genes (through retrotransposition or duplication) but have lost the original functions of their parental genes (Balakirev and Ayala 2003). Sometimes swinging between dead and alive, pseudogenes can influence the structure and function of the human genome. Their prevalence (as many as protein-coding genes) and their close similarity to functional genes have already confounded gene annotation. Recently, it has also been found that a significant fraction (up to 20%) of them are transcriptionally alive, suggesting that care has to be taken when using expression as evidence for locating genes (Yano et al. 2004; Harrison et al. 2005; Zheng et al. 2005, 2007; Frith et al. 2006). Indeed, some of the novel TARs can be attributed to pseudogene transcription (Bertone et al. 2004; Zheng et al. 2005). In a few surprising cases, a pseudogene RNA or at least a piece of it was found to be spliced with the transcript of its neighboring gene to form a gene–pseudogene chimeric transcript. These findings add one extra layer of complexity to establishing the precise structure of a gene locus. Furthermore, functional pseudogene transcripts have also been discovered in eukaryotic cells, such as the neurons of the snail Lymnaea stagnalis (Korneev et al. 1999). Also, interestingly, the human XIST gene mentioned above actually arises from the dead body of a pseudogene (Duret et al. 2006). Pseudogene transcription and the blurring boundary between genes and pseudogenes (Zheng and Gerstein 2007) emphasizes once more that the functional nature of many novel TARs needs to be resolved by future biochemical or genetic experiments (for review, see Gingeras 2007).
Constrained elements
The noncoding intergenic regions contain a large fraction of functional elements identified by examining evolutionary changes across multiple species and within the human population. The ENCODE project observed that only 40% of the evolutionarily constrained bases were within protein-coding exons or their associated untranslated regions (The ENCODE Project Consortium 2007). The resolution of constrained elements identified by multispecies analysis in the ENCODE project is very high, identifying sequences as small as 8 bases (with a median of 19 bases) (The ENCODE Project Consortium 2007). This suggests that protein-coding loci can be viewed as a cluster of small constrained elements dispersed in a sea of unconstrained sequences. Approximately another 20% of the constrained elements overlap with experimentally annotated regulatory regions. Therefore, a similar fraction of constrained elements (40% in terms of bases) is located in protein-coding regions as unannotated noncoding regions (100% – 40% coding – 20% regulatory regions), suggesting that the latter may be as functionally important as the former.
The ENCODE computational metaphor: Genes as “loosely coded” routines
The new ENCODE perspective does not, of course, fit with the metaphor of the gene as a simple callable routine in a huge operating system. In this new perspective, one enters a gene “routine” in many different ways in the framework of alternative splicing and lattices of long transcripts. The execution of the genomic OS does not have as neat a quality as this idea of repetitive calls to a discrete subroutine in a normal computer OS. However, the framework of describing the genome as executed code still has some merit. That is, one can still understand gene transcription in terms of parallel threads of execution, with the caveat that these threads do not follow canonical, modular subroutine structure. Rather, threads of execution are intertwined in a rather “higgledy-piggledy” fashion, very much like what would be described as a sloppy, unstructured computer program code with lots of GOTO statements zipping in and out of loops and other constructs.
The importance of gene models for interpreting the high-throughput experiment in ENCODE
Given the provocative findings of the ENCODE project, one wonders to what degree the interpretation of the high-throughput experiments can be pushed. This interpretation is, in fact, very contingent on using gene models.
Aspects of interpreting tiling array data
A large part of the transcription data was generated using high-density tiling microarrays (Emanuelsson et al. 2007; Rozowsky et al. 2007; The ENCODE Project Consortium 2007). The advantage of such arrays is that they probe the transcription in an unbiased and detailed way, with no preconceptions as to where to look for activity. On the other hand, the output from a tiling array experiment can be noisy and needs careful interpretation in order to allow the collection of a reliable set of transcribed regions. The amount of detected transcription depends heavily on the thresholds used when calling transcribed regions and to some extent also on the segmentation algorithms used to delineate transcribed regions from nontranscribed regions. Furthermore, since the ENCODE transcription mapping (and other) experiments were carried out on many different tissues and cell lines, direct comparison between experiments is not trivial, and the overlap between different transcription maps is sometimes quite low, partly due to the variable biological features of the samples used in the experiments.
The exact expected outcome of a transcription mapping experiment—the true transcription map—is, of course, unknown. Thus, a crucial part of interpreting transcription mapping tiling array data is to understand how the signal is different from various random expectations (null models). A naive way to achieve this goal is to randomize the raw data and then apply all the normalizing, scoring, and segmentation schemes (with unchanged parameters) to get a “baseline” of transcription that is picked up using supposedly meaningless data. But it is not clear that this is the best way to do it: GC-content, length distribution of the (actual or expected) transcribed regions, dinucleotide composition, and other characteristics should also be factored into the “baseline” transcription distribution. The expected outcome also depends on the biological sample used: tissue or cell line, developmental stage, external stimuli, etc. Integration of transcription maps from different biological sources (tissues, cell lines) provides greater confidence in the result.
Genes as statistical models summarizing many experiments
In the context of interpreting high-throughput experiments such as tiling arrays, the concept of a gene has an added practical importance—as a statistical model to help interpret and provide concise summarization to potentially noisy experimental data. For example, the transcriptional tiling array experiments ultimately identify TARs/transfrags, which usually correspond to the exons in genes. Therefore, the most appropriate gene models to be considered can be splicing graphs (Heber et al. 2002) representing exons as nodes and splicing events as directed edges.
In order to build and adjust statistical models for experimental interpretation, other related biological knowledge (e.g., gene annotation and experimental validation data) needs to be combined with the high-throughput array data. For instance, the transcriptional array data can identify isolated transcribed regions, and experimental validation such as RACE can provide connectivity information. Using these data together, the statistical models can be better trained and can then be used to analyze the rest of the high-throughput data that are not covered by the validation experiments.
Different statistical models (Karplus et al. 1999; Bertone et al. 2004; Schadt et al. 2004; Gibbons et al. 2005; Ji and Wong 2005; Li et al. 2005; Du et al. 2006; Marioni et al. 2006) have been proposed to explain the generation of the tiling array data. As shown in Figure 3, these models can be trained using the tiling array data and other biological knowledge and then extrapolated to the whole genome sequence to best segment it into functional elements. As more and more biological knowledge is accumulated, especially via the experimental validation of predicted functional regions generated by the analysis procedure, we can expect that the models will be better trained, thus leading to refined analysis results of these experiments. However, it will be impractical to validate every single functional element identified by tiling experiments using RT-PCR or RACE. For each tiling array experiment, perhaps only a medium-sized set of predicted functional regions will be validated experimentally.
Training statistical gene models based on high-density oligonucleotide tiling microarray data. (A) Large-scale signal data from tiling array experiments can be used to train statistical models to score the hits, and a small/medium proportion of these results can be further validated by experiments or other biological knowledge via runs of iterations and optimizations. (B) Different strategies can be used to select genomic regions for validation; e.g., (1) select only the regions with high signals, (2) select regions randomly, or (3) select those that have the maximum signal entropies, which usually contain “borders” of high and low signals. One question worth asking is whether an optimal way of selection exists to best help in training the statistical model.

As shown in Figure 3, the regions for experimental validation can be picked using different strategies. It is obviously beneficial to pick these regions in an optimal way so that the model trained based on these validation results can most accurately analyze the remainder of the tiling array data. In a specific case, when analyzing tiling array data using a hidden Markov model (Du et al. 2006), if the validation regions are selected to achieve maximum signal entropy, the MaxEntropy selection scheme, the resulting gene segmentation model outperforms others. For transcriptional tiling arrays, MaxEntropy will generally select regions containing both exons and introns.
Toward an updated definition of a gene
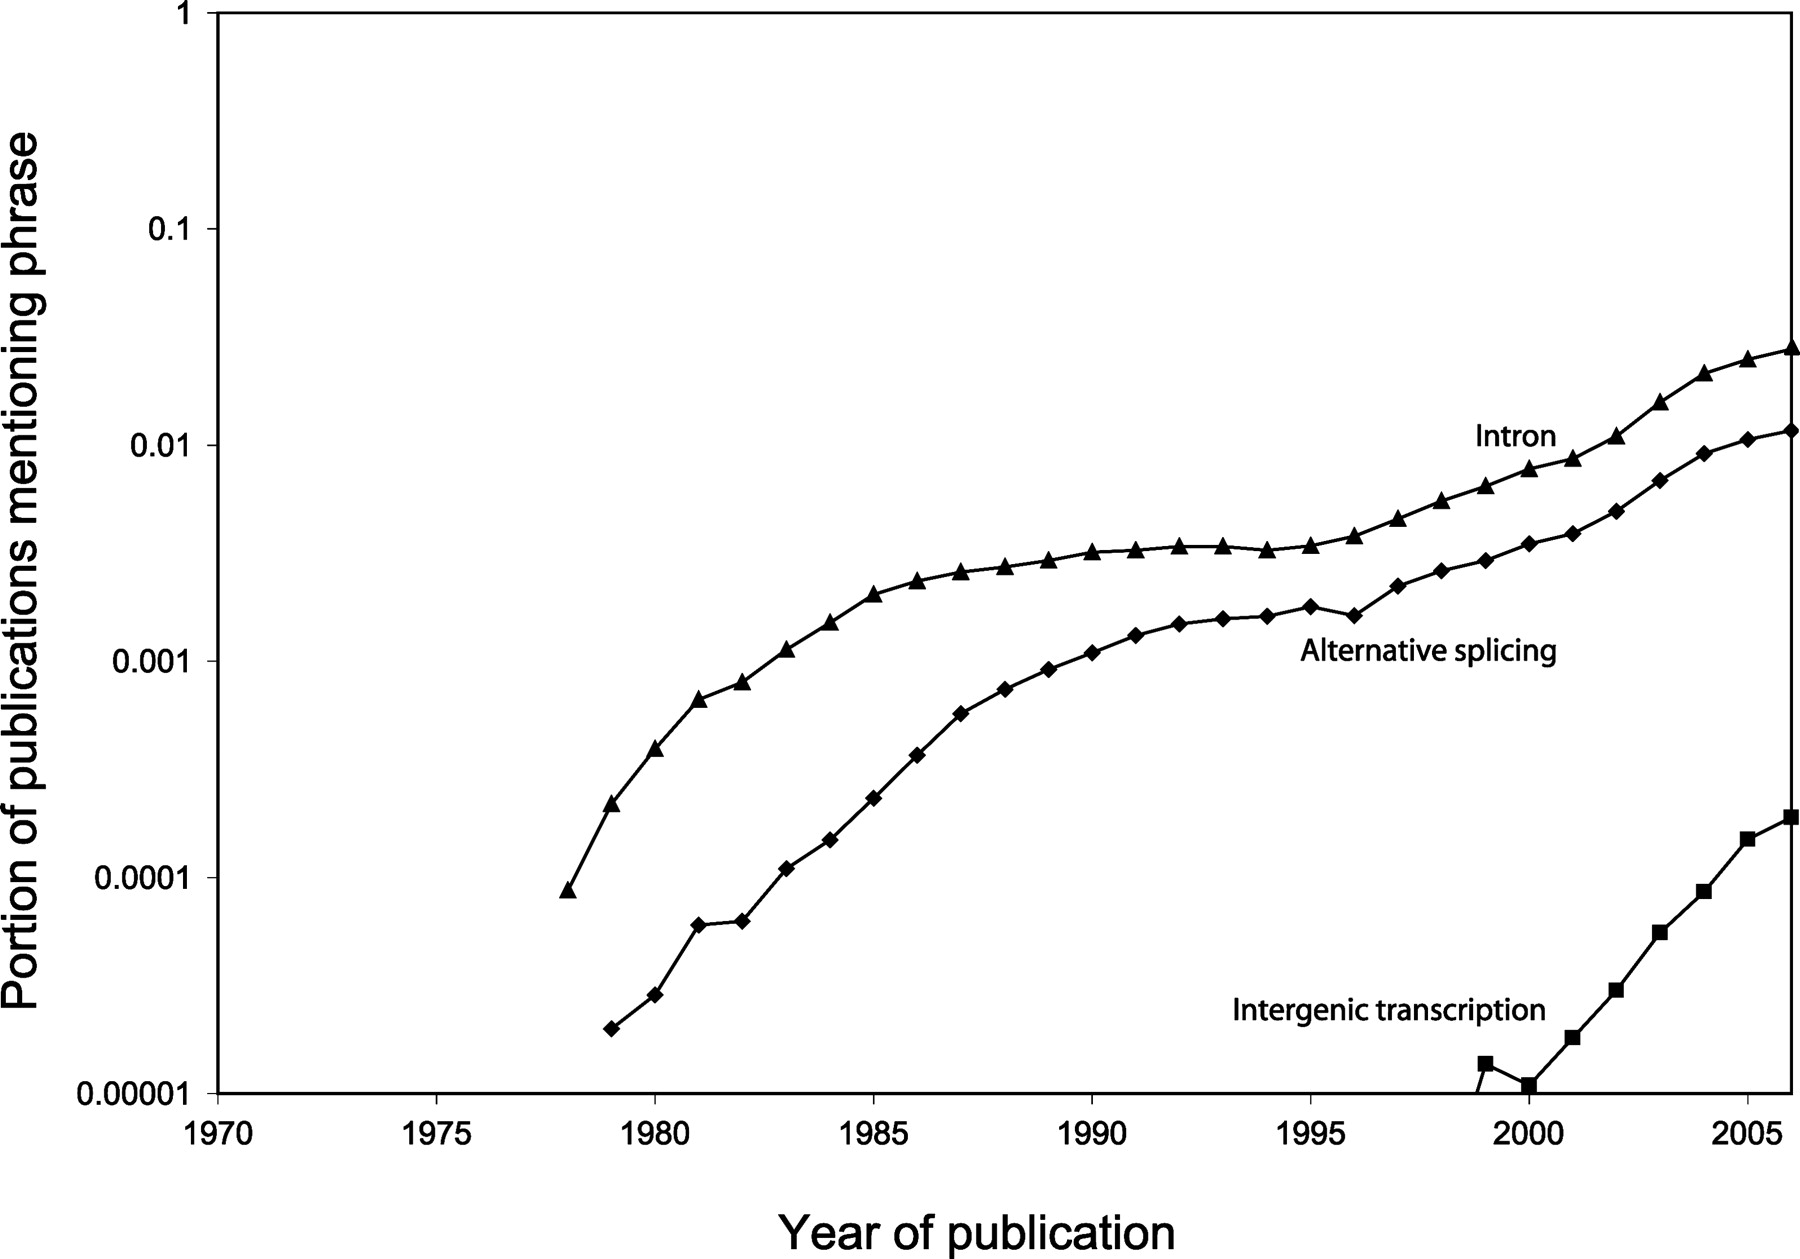
As we have described above, our knowledge of genes has evolved greatly over the past century. While our understanding has grown, we have also uncovered an increasing number of problematic aspects with simple definitions of a gene (Table 1). Splicing (including alternative splicing) and intergenic transcription are obviously some of the most problematic aspects. As shown in Figure 4, the frequency of mention of these terms in the biological literature has been increasing considerably. Thus, the stage was set for the ENCODE project and the great complexity in transcriptional and regulatory apparatus that it highlighted. At this point, it is not clear what to do: In the extreme, we could declare the concept of the gene dead and try to come up with something completely new that fits all the data. However, it would be hard to do this with consistency. Here, we made a tentative attempt at a compromise, devising updates and patches for the existing definition of a gene.
Keyword analysis and complexity of genes. Using Google Scholar, a full-text search of scientific articles was performed for the keywords “intron,” “alternative splicing,” and “intergenic transcription.” Slopes of curves indicate that in recent years the frequency of mentioning of terms relating to the complexity of a gene has increased. (The Google Scholar search was limited to articles in the following subject areas: “Biology, Life Sciences, and Environmental Science;” “Chemistry and Materials Science;” “Medicine, Pharmacology, and Veterinary Science.”)
Criteria to consider in updating the definition
First, we consider several criteria to be important while coming up with an updated definition for a gene: (1) A new definition must attempt to be backward compatible, in the sense that something that used to be called a gene should remain a gene. (2) It must be organism-independent; i.e., be as valid for bacteria as for a virus or a higher eukaryote. (3) It should be a statement of a simple idea, rather than listing various mechanisms and exceptions. (4) It should be practical enough so that one can readily enumerate genes and answer a question like “How many genes are there in the human genome?” (5) It should be compatible with other biological nomenclature that makes use of the idea of a digital gene. For instance, it should be consistent with term regulome, which represents the complete set of regulatory interactions in an organism.
A proposed updated definition
There are three aspects to the definition that we will list below, before providing the succinct definition:
A gene is a genomic sequence (DNA or RNA) directly encoding functional product molecules, either RNA or protein.
In the case that there are several functional products sharing overlapping regions, one takes the union of all overlapping genomic sequences coding for them.
This union must be coherent—i.e., done separately for final protein and RNA products—but does not require that all products necessarily share a common subsequence.
This can be concisely summarized as:
The gene is a union of genomic sequences encoding a coherent set of potentially overlapping functional products.
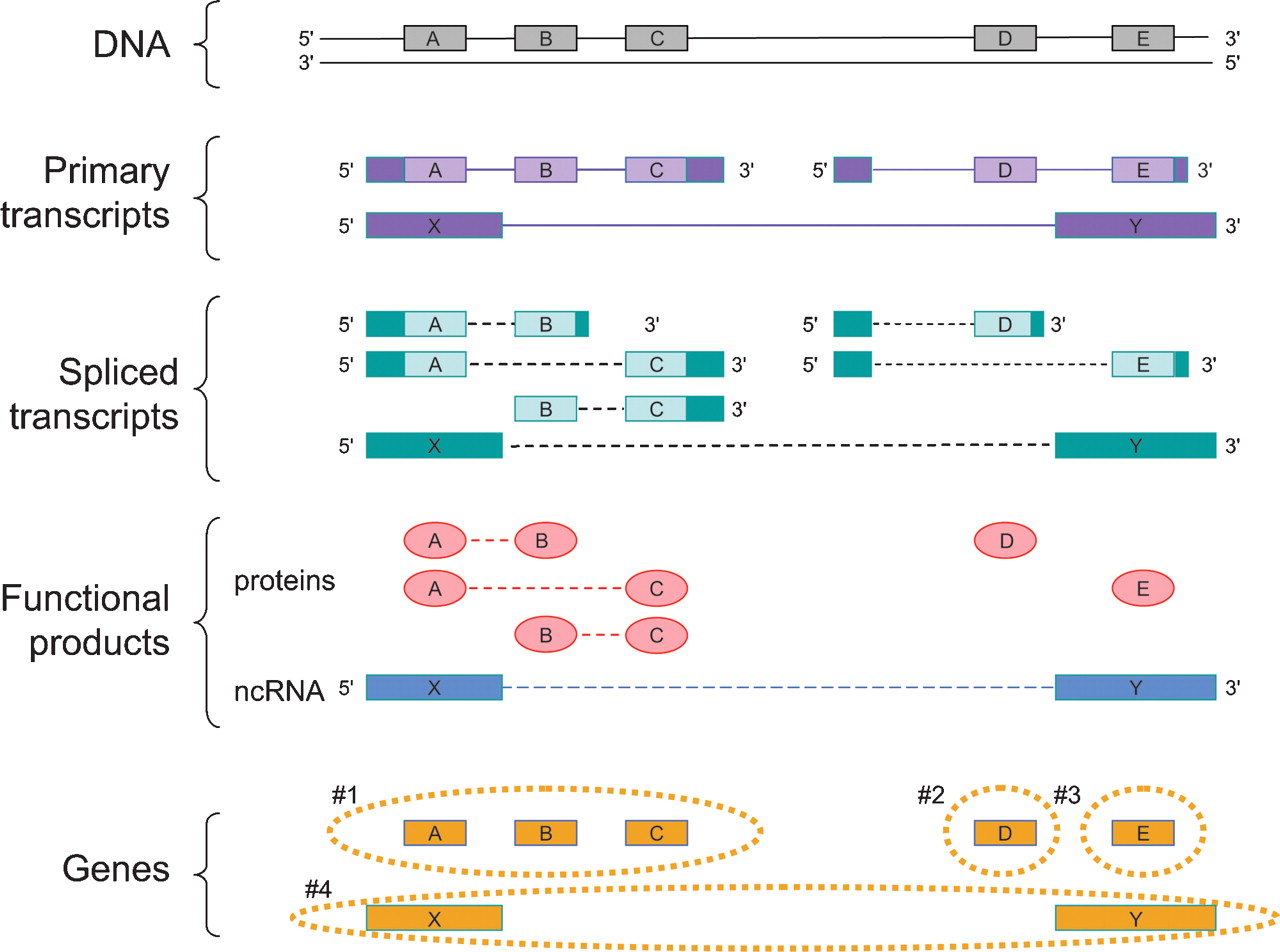
Figure 5 provides an example to illustrate the application of this definition.
How the proposed definition of the gene can be applied to a sample case. A genomic region produces three primary transcripts. After alternative splicing, products of two of these encode five protein products, while the third encodes for a noncoding RNA (ncRNA) product. The protein products are encoded by three clusters of DNA sequence segments (A, B, and C; D; and E). In the case of the three-segment cluster (A, B, C), each DNA sequence segment is shared by at least two of the products. Two primary transcripts share a 5′ untranslated region, but their translated regions D and E do not overlap. There is also one noncoding RNA product, and because its sequence is of RNA, not protein, the fact that it shares its genomic sequences (X and Y) with the protein-coding genomic segments A and E does not make it a co-product of these protein-coding genes. In summary, there are four genes in this region, and they are the sets of sequences shown inside the orange dashed lines: Gene 1 consists of the sequence segments A, B, and C; gene 2 consists of D; gene 3 of E; and gene 4 of X and Y. In the diagram, for clarity, the exonic and protein sequences A and E have been lined up vertically, so the dashed lines for the spliced transcripts and functional products indicate connectivity between the proteins sequences (ovals) and RNA sequences (boxes). (Solid boxes on transcripts) Untranslated sequences, (open boxes) translated sequences.
Aspects and implications of the definition
There are important implications of this definition.
Collapsing in simple cases
In simple cases where the gene is not discontinuous or there are no overlapping products, our definition collapses to the classical version of being a DNA sequence that codes for a protein or RNA product.
Projecting down in taking union
In our proposed definition of a gene, different functional products of the same class (protein or RNA) that overlap in their usage of the primary DNA sequence are combined into the same gene. This overlap is done by projecting the sequence of the final product (either amino acid or RNA sequence) down onto the original genomic sequence from which it was derived. One could in principle overlap the sequences of the final products (“projecting up”); however, since annotation of genes is done for genomic DNA, we think our choice is the most consistent with current practice. An obvious point that should still be stated is that, when looking at genomic products with common sequence segments, mere sequence identity is not enough; the products have to be encoded directly from the same genomic region. Thus, paralogous proteins may share sequence blocks, but DNA sequences coding for them reside in separate locations in the genome, and so they would not constitute one gene.
Frameshifted exons
There are cases, such as that of the CDKN2A (formerly INK4a/ARF) tumor suppressor gene (e.g., Quelle et al. 1995), when a pre-mRNA can be alternatively spliced to generate an mRNA with a frameshift in the protein sequence. Thus, although the two mRNAs have coding sequences in common, the protein products may be completely different. This rather unusual case brings up the question of how exactly sequence identity is to be handled when taking the union of sequence segments that are shared among protein products. If one considers the sequence of the protein products, there are two unrelated proteins, so there must be two genes with overlapping sequence sets. If one “projects” the sequence of the protein products back to the DNA sequence that encoded them (as described above), then there are two sequence sets with common elements, so there is one gene. The fact that these two proteins’ sequences are simultaneously constrained, such that a mutation in one of them would simultaneously affect the other one, suggests that this situation is not akin to that of two unrelated protein-coding genes. For this reason, generalizing from this special case, we favor the method of taking the union of the sequence segments, not of the products, but of the DNA sequences that code for the product sequences.
Regulatory regions not included
Although regulatory regions are important for gene expression, we suggest that they should not be considered in deciding whether multiple products belong to the same gene. This aspect of the definition results from our concept of the bacterial operon. The fact that genes in an operon share an operator and promoter region has traditionally not been considered to imply that their protein products are alternative products of a single gene. Consequently, in higher eukaryotes, two transcripts that originate from the same transcription start site (sharing the same promoter and regulatory elements) but do not share any sequence elements in their final products (e.g., because of alternative splicing) would not be products of the same gene. A similar logic would apply to multiple transcripts sharing a common but distant enhancer or insulator. Regulation is simply too complex to be folded into the definition of a gene, and there is obviously a many-to-many (rather than one-to-one) relationship between regulatory regions and genes.
Final products, not transcript clusters
As the updated definition emphasizes the final products of a gene, it disregards intermediate products originating from a genomic region that may happen to overlap. For example, an intronic transcript clearly shares sequences with an overlapping larger transcript, but this fact is irrelevant when we conclude that the two products share no sequence blocks. This concept can be generalized to other types of discontinuous genes, such as rearranged genes (e.g., in the immunoglobulin gene locus, the C segment is common to all protein products encoded from it), or trans-spliced transcripts (where one pre-mRNA can be spliced to a number of other pre-mRNAs before further processing and translation). This implies that the number of genes in the human genome is going to increase significantly when the survey of the human transcriptome is completed. In light of the large amount of intertwined transcripts that were identified by the ENCODE consortium, if we tried to cluster entire transcripts together to form overlapping transcript clusters (a potential alternate definition of a gene), then we would find that large segments of chromosomes would coalesce into these clusters. This alternate definition of a gene would result in far fewer “genes,” and would be of limited utility.
Alternative splicing
In relation to alternatively spliced gene products, there is the possibility that no one coding exon is shared among all protein products. In this case, it is understood that the union of these sequence segments defines the gene, as long as each exon is shared among at least two members of this group of products.
UTRs
5′ and 3′ untranslated regions (UTRs) play important roles in translation, regulation, stability, and/or localization of mRNAs. When using a strict definition of regions encoding the final product of a protein-coding gene, these regions would no longer be considered part of the gene, as is often the case in current usage. Moreover, protein-coding transcripts that share DNA sequence only in their untranslated regions or introns would not be clustered together into a common gene. By removing UTRs from the definition of a gene, one can avoid the problem of multiple 5′ and 3′ ends clouding the delineation of the gene and also avoid a situation in which upstream or trans 5′ leader sequences are spliced onto a protein coding sequence. Moreover, it has been observed that most of the longer protein-coding transcripts identified by ENCODE differ only in their UTRs, and thus our definition is quite transparent to this degree of transcript complexity.
Gene-associated regions
As described above, regulatory and untranslated regions that play an important part in gene expression would no longer be considered part of the gene. However, we would like to create a special “category” for them, by saying that they would be gene-associated. In this way, these regions still retain their important role in contributing to gene function. Moreover, their ability to contribute to the expression of several genes can be recognized. This is particularly true for long-range elements such as the beta-globin LCR, which contributes to the expression of several genes, and will likely be the case for many other enhancers as their true gene targets are mapped. It can also be applied to untranslated regions that contribute to multiple gene loci, such as the long spliced transcripts observed in the ENCODE region and trans-spliced exons.
Disjointed sets of genomic sequence
For clarity in the discussion, we refer to “DNA” when meaning genomic sequences in general. Our proposed definition is applicable to all genomes, including that of RNA viruses. In complex cases, the gene turns out not to correspond to a discrete single genetic locus, as sequences coding for its product(s) may be widely separated in the genome. In particular, because the gene is a set of sequences shared among the products, there is no requirement of connectivity between these sequences and the sequences that happen to connect them need not be part of the gene. Thus, members of a sequence can be on different strands of a chromosome or even on separate chromosomes. This means that trans-spliced transcripts belong to one gene.
Conclusion: What is function?
The classical view of a gene as a unit of hereditary information aligned along a chromosome, each coding for one protein, has changed dramatically over the past century. For Morgan, genes on chromosomes were like beads on a string. The molecular biology revolution changed this idea considerably. To quote Falk (1986), ‘‘. . . the gene is [. . .]neither discrete [. . .] nor continuous [. . .], nor does it have a constant location [. . .], nor a clearcut function [. . .], not even constant sequences [. . .] nor definite borderlines.’’ And now the ENCODE project has increased the complexity still further.
What has not changed is that genotype determines phenotype, and at the molecular level, this means that DNA sequences determine the sequences of functional molecules. In the simplest case, one DNA sequence still codes for one protein or RNA. But in the most general case, we can have genes consisting of sequence modules that combine in multiple ways to generate products. By focusing on the functional products of the genome, this definition sets a concrete standard in enumerating unambiguously the number of genes it contains.
An important aspect of our proposed definition is the requirement that the protein or RNA products must be functional for the purpose of assigning them to a particular gene. We believe this connects to the basic principle of genetics, that genotype determines phenotype. At the molecular level, we assume that phenotype relates to biochemical function. Our intention is to make our definition backwardly compatible with earlier concepts of the gene.
This emphasis on functional products, of course, highlights the issue of what biological function actually is. With this, we move the hard question from “what is a gene?” to “what is a function?”
High-throughput biochemical and mutational assays will be needed to define function on a large scale (Lan et al. 2002, 2003). Hopefully, in most cases it will just be a matter of time until we acquire the experimental evidence that will establish what most RNAs or proteins do. Until then we will have to use “place-holder” terms like TAR, or indicate our degree of confidence in assuming function for a genomic product. We may also be able to infer functionality from the statistical properties of the sequence (e.g., Ponjavic et al. 2007).
However, we probably will not be able to ever know the function of all molecules in the genome. It is conceivable that some genomic products are just “noise,” i.e., results of evolutionarily neutral events that are tolerated by the organism (e.g., Tress et al. 2007). Or, there may be a function that is shared by so many other genomic products that identifying function by mutational approaches may be very difficult. While determining biological function may be difficult, proving lack of function is even harder (almost impossible). Some sequence blocks in the genome are likely to keep their labels of “TAR of unknown function” indefinitely. If such regions happen to share sequences with functional genes, their boundaries (or rather, the membership of their sequence set) will remain uncertain. Given that our definition of a gene relies so heavily on functional products, finalizing the number of genes in our genome may take a long time.
Acknowledgments
We thank the ENCODE consortium, and acknowledge the following funding sources: ENCODE grant #U01HG03156 from the National Human Genome Research Institute (NHGRI)/National Institutes of Health (NIH); NIH Grant T15 LM07056 from the National Library of Medicine (C.B., Z.D.Z.); and a Marie Curie Outgoing International Fellowship (J.O.K).
References
- ↵P. Akiva,A. Toporik,S. Edelheit,Y. Peretz,A. Diber,R. Shemesh,A. Novik,R. Sorek,(2006) Transcription-mediated gene fusion in the human genome. Genome Res. 16:30–36.
- ↵O.T. Avery,C.M. MacLeod,M. McCarty,(1944) Studies on the chemical nature of the substance inducing transformation of pneumococcal types. J. Exp. Med. 79:137–158.
- ↵E.S. Balakirev,F.J. Ayala,(2003) Pseudogenes: Are they “junk” or functional DNA? Annu. Rev. Genet. 37:123–151.
- ↵G.W. Beadle,E.L. Tatum,(1941) Genetic control of biochemical reactions in Neurospora. Proc. Natl. Acad. Sci. 27:499–506.
- ↵S. Benzer,(1955) Fine structure of a genetic region in bacteriophage. Proc. Natl. Acad. Sci. 41:344–354.
- ↵S.M. Berget,C. Moore,P.A. Sharp,(1977) Spliced segments at the 5′ terminus of adenovirus 2 late mRNA. Proc. Natl. Acad. Sci. 74:3171–3175.
- ↵P. Bertone,V. Stolc,T.E. Royce,J.S. Rozowsky,A.E. Urban,X. Zhu,J.L. Rinn,W. Tongprasit,M. Samanta,S. Weissman,(2004) Global identification of human transcribed sequences with genome tiling arrays. Science 306:2242–2246.
- ↵T. Blumenthal,(2005) Trans-splicing and operons. WormBook (ed. The C. elegans Research Community) WormBook, doi/10.1895/wormbook.1.5.1, http://www.wormbook.org.
- P. Borst,(1986) Discontinuous transcription and antigenic variation in trypanosomes. Annu. Rev. Biochem. 55:701–732.
- ↵S. Cawley,S. Bekiranov,H.H. Ng,P. Kapranov,E.A. Sekinger,D. Kampa,A. Piccolboni,V. Sementchenko,J. Cheng,A.J. Williams,(2004) Unbiased mapping of transcription factor binding sites along human chromosomes 21 and 22 points to widespread regulation of noncoding RNAs. Cell 116:499–509.
- ↵J. Cheng,P. Kapranov,J. Drenkow,S. Dike,S. Brubaker,S. Patel,J. Long,D. Stern,H. Tammana,G. Helt,(2005) Transcriptional maps of 10 human chromosomes at 5-nucleotide resolution. Science 308:1149–1154.
- ↵L.T. Chow,R.E. Gelinas,T.R. Broker,R.J. Roberts,(1977) An amazing sequence arrangement at the 5′ ends of adenovirus 2 messenger RNA. Cell 12:1–8.
- ↵C. Chureau,M. Prissette,A. Bourdet,V. Barbe,L. Cattolico,L. Jones,A. Eggen,P. Avner,L. Duret,(2002) Comparative sequence analysis of the X-inactivation center region in mouse, human, and bovine. Genome Res. 12:894–908.
- R. Contreras,R. Rogiers,V.A. Van de,W. Fiers,(1977) Overlapping of the VP2-VP3 gene and the VP1 gene in the SV40 genome. Cell 12:529–538.
- ↵F.H.C. Crick,(1958) On protein synthesis. Symp. Soc. Exp. Biol. XII:138–163.
- ↵R. Dawkins,(1976) The selfish gene (Oxford University Press, Oxford, UK).
- ↵F. Denoeud,P. Kapranov,C. Ucla,A. Frankish,R. Castelo,J. Drenkow,J. Lagarde,T. Alioto,C. Manzano,J. Chrast,(2007) Prominent use of distal 5′ transcription start sites and discovery of a large number of additional exons in ENCODE regions. Genome Res. 10.1101/gr5660607, (this issue).
- A. Dobrovic,J.L. Gareau,G. Ouellette,W.E. Bradley,(1988) DNA methylation and genetic inactivation at thymidine kinase locus: Two different mechanisms for silencing autosomal genes. Somat. Cell Mol. Genet. 14:55–68.
- ↵R. Doolittle,(1986) Of URFs and ORFs: A primer on how to analyze derived amino acid sequences (University Science Books, Mill Valley, CA).
- ↵J. Du,J.S. Rozowsky,J. Korbel,Z.D. Zhang,T.E. Royce,M.H. Schultz,M. Snyder,M. Gerstein,(2006) A supervised hidden Markov model framework for efficiently segmenting tiling array data in transcriptional and ChIP–chip experiments: Systematically incorporating validated biological knowledge. Bioinformatics 22:3016–3024.
- ↵L. Duret,C. Chureau,S. Samain,J. Weissenbach,P. Avner,(2006) The Xist RNA gene evolved in eutherians by pseudogenization of a protein-coding gene. Science 312:1653–1655.
- P. Early,H. Huang,M. Davis,K. Calame,L. Hood,(1980) An immunoglobulin heavy chain variable region gene is generated from three segments of DNA: VH, D and JH. Cell 19:981–992.
- ↵S.R. Eddy,(2001) Non-coding RNA genes and the modern RNA world. Nat. Rev. Genet. 2:919–929.
- H. Eisen,(1988) RNA editing: Who’s on first? Cell 53:331–332.
- ↵O. Emanuelsson,U. Nagalakshmi,D. Zheng,J.S. Rozowsky,A.E. Urban,J. Du,Z. Lian,V. Stolc,S. Weissman,M. Snyder,(2007) Assessing the performance of different high-density tiling microarray strategies for mapping transcribed regions of the human genome. Genome Res. 10.1101/gr.5014606, (this issue).
- ↵The ENCODE Project Consortium, (2007) Identification and analysis of functional elements in 1% of the human genome by the ENCODE pilot project. Nature, (in press).
- ↵G. Euskirchen,T.E. Royce,P. Bertone,R. Martone,J.L. Rinn,F.K. Nelson,F. Sayward,N.M. Luscombe,P. Miller,M. Gerstein,(2004) CREB binds to multiple loci on human chromosome 22. Mol. Cell. Biol. 24:3804–3814.
- ↵R. Falk,(1986) What is a gene? Stud. Hist. Philos. Sci. 17:133–173.
- ↵W. Fiers,R. Contreras,R. De Wachter,G. Haegeman,J. Merregaert,W.M. Jou,A. Vandenberghe,(1971) Recent progress in the sequence determination of bacteriophage MS2 RNA. Biochimie 53:495–506.
- ↵W. Fiers,R. Contreras,F. Duerinck,G. Haegeman,D. Iserentant,J. Merregaert,W. MinJou,F. Molemans,A. Raeymakers,A. Van den Berghe,(1976) Complete nucleotide sequence of bacteriophage MS2 RNA: Primary and secondary structure of the replicase gene. Nature 260:500–507.
- ↵R.D. Fleischmann,M.D. Adams,O. White,R.A. Clayton,E.F. Kirkness,A.R. Kerlavage,C.J. Bult,J.F. Tomb,B.A. Dougherty,J.M. Merrick,(1995) Whole-genome random sequencing and assembly of Haemophilus influenzae Rd. Science 269:496–512.
- ↵M.C. Frith,L.G. Wilming,A. Forrest,H. Kawaji,S.L. Tan,C. Wahlestedt,V.B. Bajic,C. Kai,J. Kawai,P. Carninci,(2006) Pseudo-messenger RNA: Phantoms of the transcriptome. PLoS Genet. 2:e23.
- ↵R.E. Gelinas,R.J. Roberts,(1977) One predominant 5′-undecanucleotide in adenovirus 2 late messenger RNAs. Cell 11:533–544.
- ↵F.D. Gibbons,M. Proft,K. Struhl,F.P. Roth,(2005) Chipper: Discovering transcription-factor targets from chromatin immunoprecipitation microarrays using variance stabilization. Genome Biol. 6:R96.
- ↵T. Gingeras,(2007) Origin of phenotypes: Genes and transcripts. Genome Res. 10.1101/gr.625007, (this issue).
- ↵F. Griffith,(1928) The significance of pneumococcal types. J. Hyg. (Lond.) 27:113–159.
- ↵P.E. Griffiths,K. Stotz,(2006) Genes in the postgenomic era. Theor. Med. Bioeth. 27:499–521.
- H. Handa,G. Bonnard,J.M. Grienenberger,(1996) The rapeseed mitochondrial gene encoding a homologue of the bacterial protein Ccl1 is divided into two independently transcribed reading frames. Mol. Gen. Genet. 252:293–302.
- ↵P.M. Harrison,D. Zheng,Z. Zhang,N. Carriero,M. Gerstein,(2005) Transcribed processed pseudogenes in the human genome: An intermediate form of expressed retrosequence lacking protein-coding ability. Nucleic Acids Res. 33:2374–2383.
- ↵J. Harrow,F. Denoeud,A. Frankish,A. Reymond,C.K. Chen,J. Chrast,J. Lagarde,J.G. Gilbert,R. Storey,D. Swarbreck,(2006) GENCODE: Producing a reference annotation for ENCODE. Genome Biol. 7 Suppl. 1:S4.1–S9.
- ↵S. Heber,M. Alekseyev,S. Sze,H. Tang,P.A. Pevzner,(2002) Splicing graphs and EST assembly problem. Bioinformatics 18:S181–S188.
- ↵J. Heimans,(1962) Hugo de Vries and the gene concept. Am. Nat. 96:93–104.
- S. Henikoff,M.A. Keene,K. Fechtel,J.W. Fristrom,(1986) Gene within a gene: Nested Drosophila genes encode unrelated proteins on opposite DNA strands. Cell 44:33–42.
- ↵A.D. Hershey,M. Chase,(1955) An upper limit to the protein content of the germinal substance of bacteriophage T2. Virology 1:108–127.
- A.J. Iafrate,L. Feuk,M.N. Rivera,M.L. Listewnik,P.K. Donahoe,Y. Qi,S.W. Scherer,C. Lee,(2004) Detection of large-scale variation in the human genome. Nat. Genet. 36:949–951.
- ↵F. Jacob,J. Monod,(1961) Genetic regulatory mechanisms in the synthesis of proteins. J. Mol. Biol. 3:318–356.
- ↵H. Ji,W.H. Wong,(2005) TileMap: Create chromosomal map of tiling array hybridizations. Bioinformatics 21:3629–3636.
- ↵W. Johannsen,(1909) Elemente der exakten Erblichkeitslehre, Jena. Quoted by Nils Roll-Hansen (1989). The crucial experiment of Wilhelm Johannsen. Biol. Philos. 4:303–329.
- ↵P. Kapranov,S.E. Cawley,J. Drenkow,S. Bekiranov,R.L. Strausber,S.P. Fodor,T.R. Gingeras,(2002) Large-scale transcriptional activity in chromosomes 21 and 22. Science 296:916–919.
- ↵K. Karplus,C. Barrett,M. Cline,M. Diekhans,L. Grate,R. Hughey,(1999) Predicting protein structure using only sequence information. Proteins 37 (Suppl 3) 121–125.
- ↵T.H. Kim,L.O. Barrera,M. Zheng,C. Qu,M.A. Singer,T.A. Richmond,Y. Wu,R.D. Green,B. Ren,(2005) A high-resolution map of active promoters in the human genome. Nature 436:876–880.
- ↵S.A. Korneev,J.H. Park,M. O’Shea,(1999) Neuronal expression of neural nitric oxide synthase (nNOS) protein is suppressed by an antisense RNA transcribed from an NOS pseudogene. J. Neurosci. 19:7711–7720.
- ↵N. Lan,R. Jansen,M. Gerstein,(2002) Towards a systematic definition of protein function that scales to the genome level: Defining function in terms of interactions. Proc. IEEE 90:1848–1858.
- ↵N. Lan,G.T. Montelione,M. Gerstein,(2003) Ontologies for proteomics: Towards a systematic definition of structure and function that scales to the genome level. Curr. Opin. Chem. Biol. 7:44–54.
- ↵E.S. Lander,L.M. Linton,B. Birren,C. Nusbaum,M.C. Zody,J. Baldwin,K. Devon,K. Dewar,M. Doyle,W. FitzHugh,(2001) Initial sequencing and analysis of the human genome. Nature 409:860–921.
- ↵W. Li,C.A. Meyer,X.S. Liu,(2005) A hidden Markov model for analyzing ChIP–chip experiments on genome tiling arrays and its application to p53 binding sequences. Bioinformatics 21:i274–i282.
- ↵K.C.M. Lindblad-Toh,T.S. Wade,E.K. Mikkelsen,D.B. Karlsson,M. Jaffe,M. Kamal,J.L. Clamp,E.J. Chang,M.C. Kulbokas, 3rdE. Zody,(2005) Genome sequence, comparative analysis and haplotype structure of the domestic dog. Nature 438:803–819.
- ↵H. Lodish,M.P. Scott,P. Matsudaira,J. Darnell,L. Zipursky,C.A. Kaiser,A. Berk,M. Krieger,(2000) Molecular cell biology (Freeman and Co. New York) 5th ed..
- ↵J.C. Marioni,N.P. Thorne,S. Tavare,(2006) BioHMM: A heterogeneous hidden Markov model for segmenting array CGH data. Bioinformatics 22:1144–1146.
- ↵J.S. Mattick,I.V. Makunin,(2006) Non-coding RNA. Hum. Mol. Genet. 15 Spec. No. 1:R17–R29.
- ↵B. McClintock,(1929) A cytological and genetical study of triploid maize. Genetics 14:180–222.
- ↵B. McClintock,(1948) Mutable loci in maize. Carnegie Inst. Wash. Year Book 47:155–169.
- ↵J.G. Mendel,(1866) Verhandlungen des naturforschenden Vereines in Brünn 4 Abhandlungen, 3–47, Versuche über Pflanzenhybriden. Cited by Robert C. Olby (1997) on http://www.mendelweb.org/MWolby.html, accessed 2007-03-16.
- ↵T.H. Morgan,A.H. Sturtevant,H.J. Muller,C.B. Bridges,(1915) The mechanism of Mendelian heredity (Holt Rinehart & Winston, New York).
- ↵H.J. Muller,(1927) Artificial transmutation of the gene. Science 46:84–87.
- ↵M. Nirenberg,P. Leder,M. Bernfield,R. Brimacombe,J. Trupin,F. Rottman,C. O’Neal,(1965) RNA codewords and protein synthesis, VII. On the general nature of the RNA code. Proc. Natl. Acad. Sci. 53:1161–1168.
- ↵S. Ohno,(1972) in Evolution of genetic systems in Brookhaven Symposia in Biology, So much “junk” DNA in the genome, ed H.H.. Smith, (Gordon & Breach, New York), 23, pp 366–370.
- ↵G. Parra,A. Reymond,N. Dabbouseh,E.T. Dermitzakis,R. Castelo,T.M. Thomson,S.E. Antonarakis,R. Guigó,(2006) Tandem chimerism as a means to increase protein complexity in the human genome. Genome Res. 16:37–44.
- J. Paul,(1972) General theory of chromosome structure and gene activation in eukaryotes. Nature 238:444–446.
- ↵H. Pearson,(2006) Genetics: What is a gene? Nature 441:398–401.
- ↵J.S. Pedersen,G. Bejerano,A. Siepel,K. Rosenbloom,K. Lindblad-Toh,E.S. Lander,J. Kent,W. Miller,D. Haussler,(2006) Identification and classification of conserved RNA secondary structures in the human genome. PLoS Comput. Biol. 10.1371/journal.pcbi.0020033.
- ↵J. Ponjavic,C.P. Ponting,G. Lunter,(2007) Functionality or transcriptional noise? Evidence for selection within long noncoding RNAs. Genome Res. 17:556–565.
- ↵D.E. Quelle,F. Zindy,R.A. Ashmun,C.J. Sherr,(1995) Alternative reading frames of the INK4a tumor suppressor gene encode two unrelated proteins capable of inducing cell cycle arrest. Cell 83:993–1000.
- ↵H.G. Rheinberger,(1995) When did Darl Correns read Gregor Mendel’s paper? Isis 86:612–616.
- ↵J.L. Rinn,G. Euskirchen,P. Bertone,R. Martone,N.M. Luscombe,S. Hartman,P.M. Harrison,F.K. Nelson,P. Mille,M. Gerstein,(2003) The transcriptional activity of human chromosome 22. Genes & Dev. 17:529–540.
- ↵S. Rogic,A.K. Mackworth,F.B. Ouellette,(2001) Evaluation of gene-finding programs on mammalian sequences. Genome Res. 11:817–832.
- ↵J. Rozowsky,D. Newburger,F. Sayward,J. Wu,G. Jordan,J.O. Korbel,U. Nagalakshmi,J. Yang,D. Zheng,R. Guigo,(2007) The DART classification of unannotated transcription within the ENCODE regions: Associating transcription with known and novel loci. Genome Res. 10.1101/gr.5696007, (this issue).
- R. Sager,R. Kitchin,(1975) Selective silencing of eukaryotic DNA. Science 189:426–433.
- ↵E.E. Schadt,S.W. Edwards,D. Guhathakurta,D. Holder,L. Ying,V. Svetnik,A. Leonardson,K.W. Hart,A. Russell,G. Li,(2004) A comprehensive transcript index of the human genome generated using microarrays and computational approaches. Genome Biol. 5:R73.
- ↵D.B. Searls,(1997) Abstract: Linguistic approaches to biological sequences. Comput. Appl. Biosci. 13:333–344.
- ↵D.B. Searls,(2001) Reading the book of life. Bioinformatics 17:579–580.
- ↵D.B. Searls,(2002) The language of genes. Nature 420:211–217.
- J. Sebat,B. Lakshmi,J. Troge,J. Alexander,J. Young,P. Lundin,S. Maner,H. Massa,M. Walker,M. Chi,(2004) Large-scale copy number polymorphism in the human genome. Science 305:525–528.
- ↵Y. Shi,E. Seto,L.S. Chang,K.T. Shen,(1991) Transcriptional repression by YY1, a human GLI-Kruppel-related protein, and relief of repression by adenovirus E1A protein. Cell 67:377–388.
- ↵D. Söll,E. Ohtsuka,D.S. Jones,R. Lohrmann,H. Hayatsu,S. Nishimura,H.G. Khorana,(1965) Studies on polynucleotides, XLIX. Stimulation of the binding of aminoacyl-sRNA’s to ribosomes by ribotrinucleotides and a survey of codon assignments for 20 amino acids. Proc. Natl. Acad. Sci. 54:1378–1385.
- C. Spilianakis,M. Lalioti,T. Town,G. Lee,R. Flavell,(2005) Interchromosomal associations between alternatively expressed loci. Nature 435:637–645.
- ↵H. Sturtevant,(1913) The linear arrangement of six sex-linked factors in Drosophila as shown by their mode of association. J. Exp. Zool. 14:43–59.
- T. Takahara,S.I. Kanazu,S. Yanagisawa,H. Akanuma,(2000) Heterogeneous Sp1 mRNAs in human HepG2 cells include a product of homotypic trans-splicing. J. Biol. Chem. 275:38067–38072.
- ↵D. Torrents,M. Suyama,E. Zdobnov,P. Bork,(2003) A genome-wide survey of human pseudogenes. Genome Res. 13:2559–2567.
- ↵M. Tress,P.L. Martelli,A. Frankish,G. Reeves,J.J. Wesselink,C. Yeats,P.I. Olason,M. Albrecht,H. Hegyi,A. Giorgetti,(2007) The implications of alternative splicing in the ENCODE protein complement. Proc. Natl. Acad. Sci. 104:5495–5500.
- ↵E. Tschermak,(1900) Über Künstliche Kreuzung bei Pisum sativum. Berichte Deutsche Botanischen. Gesellschaft 18:232–239.
- ↵D.Y. Tuan,W.B. Solomon,I.M. London,D.P. Lee,(1989) An erythroid-specific, developmental-stage-independent enhancer far upstream of the human “β-like globin” genes. Proc. Natl. Acad. Sci. 86:2554–2558.
- E. Tuzun,A.J. Sharp,J.A. Bailey,R. Kaul,V.A. Morrison,L.M. Pertz,E. Haugen,H. Hayden,D. Albertson,D. Pinkel,(2005) Fine-scale structural variation of the human genome. Nat. Genet. 37:727–732.
- E.F. Vanin,G.I. Goldberg,P.W. Tucker,O. Smithies,(1980) A mouse α-globin-related pseudogene lacking intervening sequences. Nature 286:222–226.
- ↵J.C. Venter,M.D. Adams,E.W. Myers,P.W. Li,R.J. Mural,G.G. Sutton,H.O. Smith,M. Yandell,C.A. Evans,R.A. Holt,(2001) The sequence of the human genome. Science 291:1304–1351.
- L. Villa-Komaroff,N. Guttman,D. Baltimore,H.F. Lodishi,(1975) Complete translation of poliovirus RNA in a eukaryotic cell-free system. Proc. Natl. Acad. Sci. 72:4157–4161.
- ↵H. Vries,(1900) Sur la loi de disjonction des hybrides. Comptes rendus de l’Académie des Sciences (Paris) 130:845–847.
- ↵N. Wade,(2003) Gene sweepstakes ends, but winner may well be wrong. New York Times, http://query.nytimes.com/gst/fullpage.html?sec=health&res=9A02E0D81230F930A35755C0A9659C8B63.
- ↵H.M. Wain,E.A. Bruford,R.C. Lovering,M.J. Lush,M.W. Wright,S. Povey,(2002) Guidelines for human gene nomenclature. Genomics 79:464–470.
- ↵S. Washietl,I.L. Hofacker,M. Lukasser,A. Huttenhofer,P.F. Stadler,(2005) Mapping of conserved RNA secondary structures predicts thousands of functional noncoding RNAs in the human genome. Nat. Biotechnol. 23:1383–1390.
- ↵S. Washietl,J.S. Pedersen,J.O. Korbel,C. Stocsits,A.R. Gruber,J. Hackermüller,J. Hertel,M. Lindemeyer,K. Reiche,A. Tanzer,(2007) Structured RNAs in the ENCODE selected regions of the human genome. Genome Res. 10.1101/gr.5650707, (this issue).
- ↵R.H. Waterston,K. Lindblad-Toh,E. Birney,J. Rogers,J.F. Abril,P. Agarwal,R. Agarwala,R. Ainscough,M. Alexandersson,P. An,(2002) Initial sequencing and comparative analysis of the mouse genome. Nature 420:520–562.
- ↵J.D. Watson,F.H.C. Crick,(1953) A structure of deoxyribonucleic acid. Nature 171:964–967.
- F. Wold,(1981) In vivo chemical modification of proteins (post-translational modification) Annu. Rev. Biochem. 50:783–814.
- ↵Y. Yano,R. Saito,N. Yoshida,A. Yoshiki,A. Wynshaw-Boris,M. Tomita,S. Hirotsune,(2004) A new role for expressed pseudogenes as ncRNA: Regulation of mRNA stability of its homologous coding gene. J. Mol. Med. 82:414–422.
- ↵Z. Zhang,P.M. Harrison,Y. Liu,M. Gerstein,(2003) Millions of years of evolution preserved: A comprehensive catalog of the processed pseudogenes in the human genome. Genome Res. 13:2541–2558.
- ↵Z.D. Zhang,A. Paccanaro,Y. Fu,S. Weissman,Z. Weng,J. Chang,M. Snyder,M.B. Gerstein,(2007) Statistical analysis of the genomic distribution and correlation of regulatory elements in the ENCODE regions. Genome Res. 10.1101/gr.5573107, (this issue).
- ↵D. Zheng,M.B. Gerstein,(2007) The ambiguous boundary between genes and pseudogenes: The dead rise up, or do they? Trends Genet. 23:219–224.
- ↵D. Zheng,Z. Zhang,P.M. Harrison,J. Karro,N. Carriero,M. Gerstein,(2005) Integrated pseudogene annotation for human chromosome 22: Evidence for transcription. J. Mol. Biol. 349:27–45.
- D. Zheng,A. Frankish,R. Baertsch,P. Kapranov,A. Reymond,S.W. Choo,Y. Lu,F. Denoeud,S.E. Antonarakis,M. Snyder,(2007) Pseudogenes in the ENCODE regions: Consensus annotation, analysis of transcription, and evolution. Genome Res. 10.1101/gr.5586307, (this issue).
Notes
[1] Article is online at http://www.genome.org/cgi/doi/10.1101/gr.6339607