
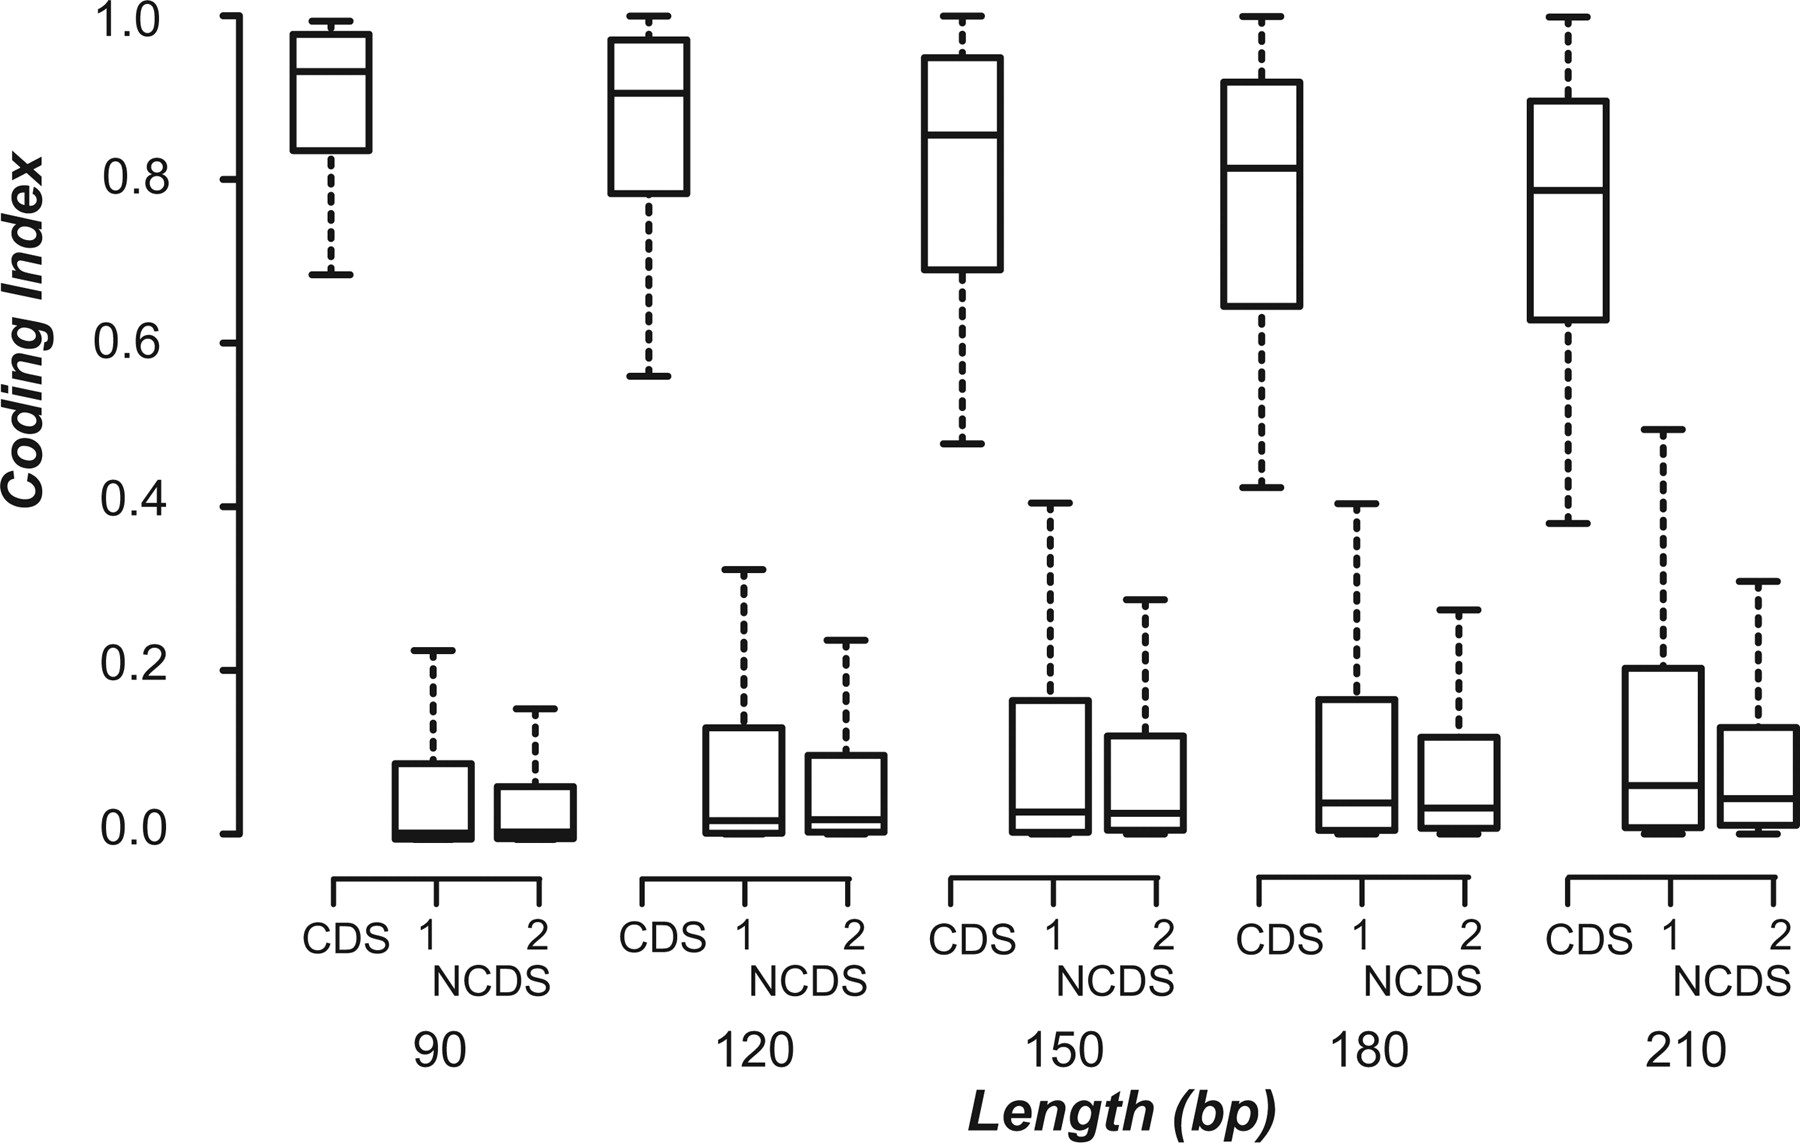
Figure 4.
Distributions of CI values of CDS and NCDS The CI value distributions are shown as box plots with the solid horizontal line indicating the median CI value, the box representing the inter quartile range (25%–75%), and the dotted line indicating the first to the 99th percentile. CDS refers to the exon coding sequences derived from full-length cDNAs. sORFs of NCDSs are obtained from two types of sequences: (1) annotated intergenic regions and (2) intron sequences derived from full-length cDNAs.


