
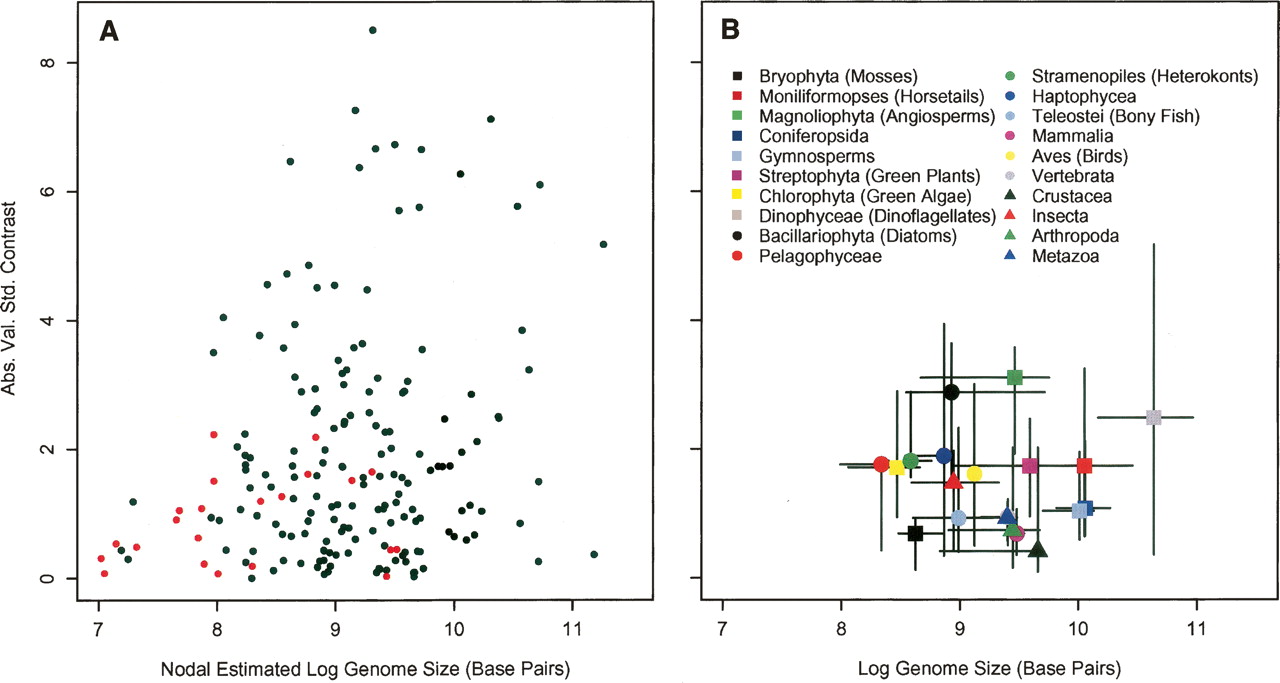
Figure 4.
A priori Log10 transformation of genome size removes the proportional effect of genome size on the rate of genome size evolution. (A) A tree-wise analysis of the nodal estimated genome size and the calculated contrast at each node shows no significant correlation. (B) The distribution of the median absolute contrast and the median genome size of 20 traditionally recognized taxonomic groups also shows no significant correlation. Bars represent bootstrapped 95% confidence intervals. As in Figure 3A, red dots represent estimations from the 31-ortholog tree and black dots represent estimations from the 18S rDNA tree.


