
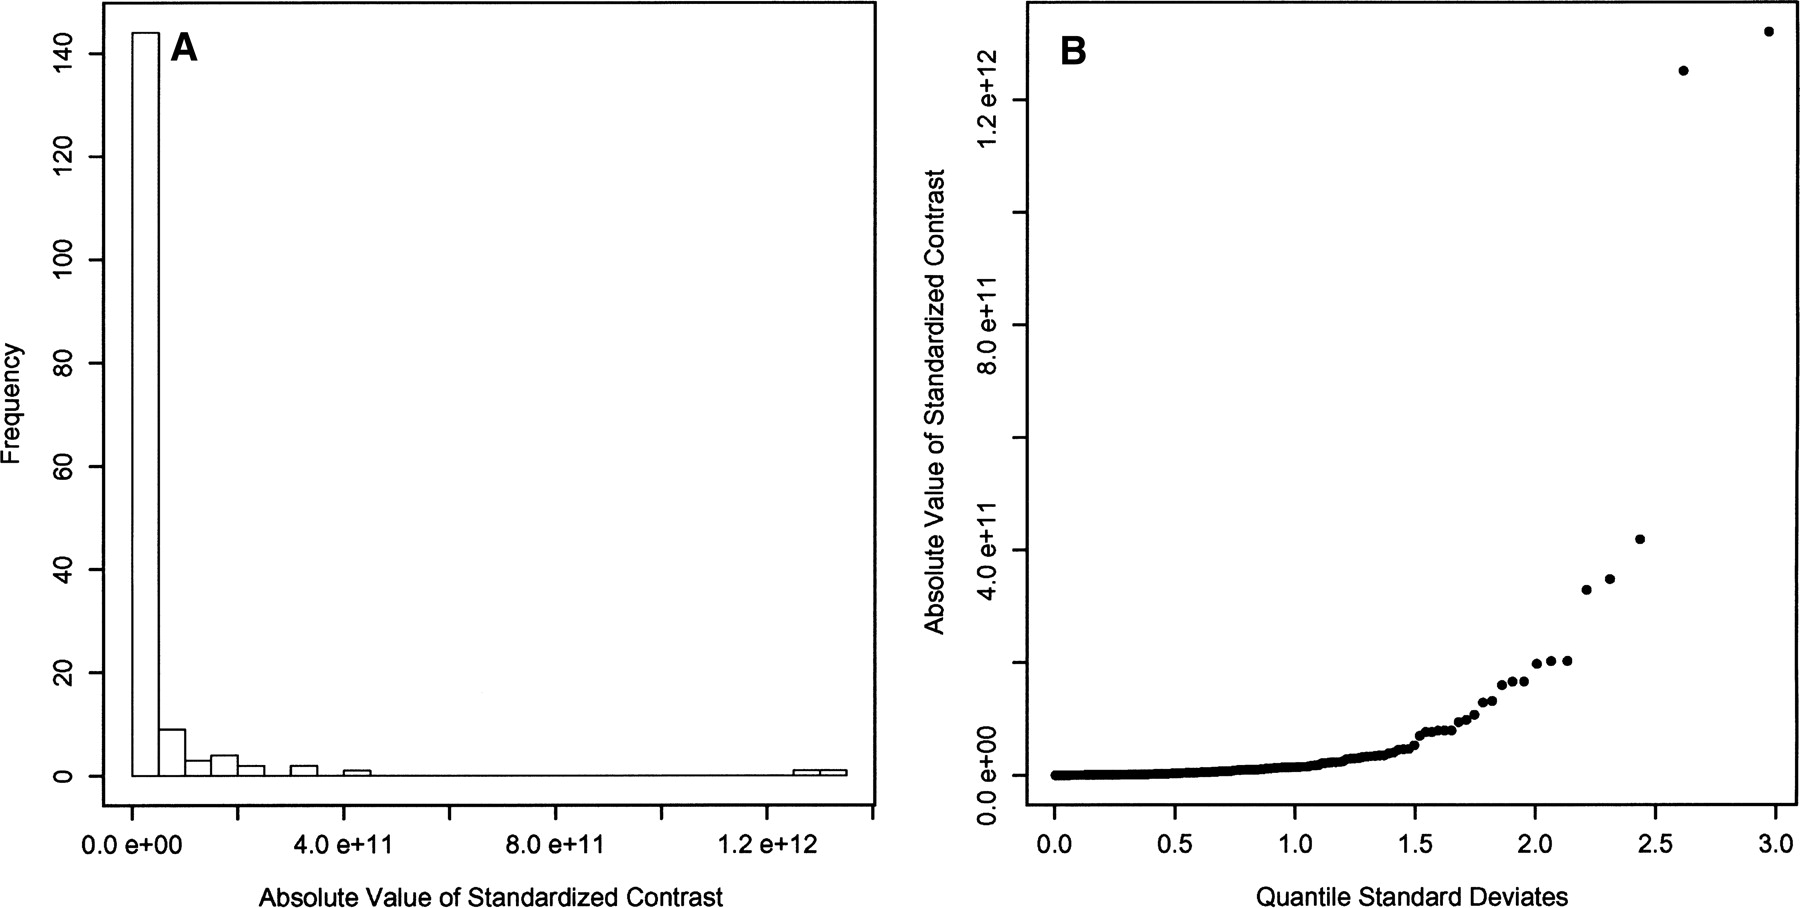
Figure 3.
(A) Distribution of the absolute value of the standardized contrasts from the 18S rDNA tree showing a strong deviation from the right one-half normal positive distribution expected from a phenotypic trait under Brownian evolution. A strong deviation would be expected for a trait under proportional evolution. (B) Quantile distribution of the absolute value of the standardized contrasts. These contrasts do not show a near-linear relationship to the positive quantile standard deviates, indicating a strong deviation from a right one-half normal positive distribution. This is expected for a trait under proportional evolution.


