
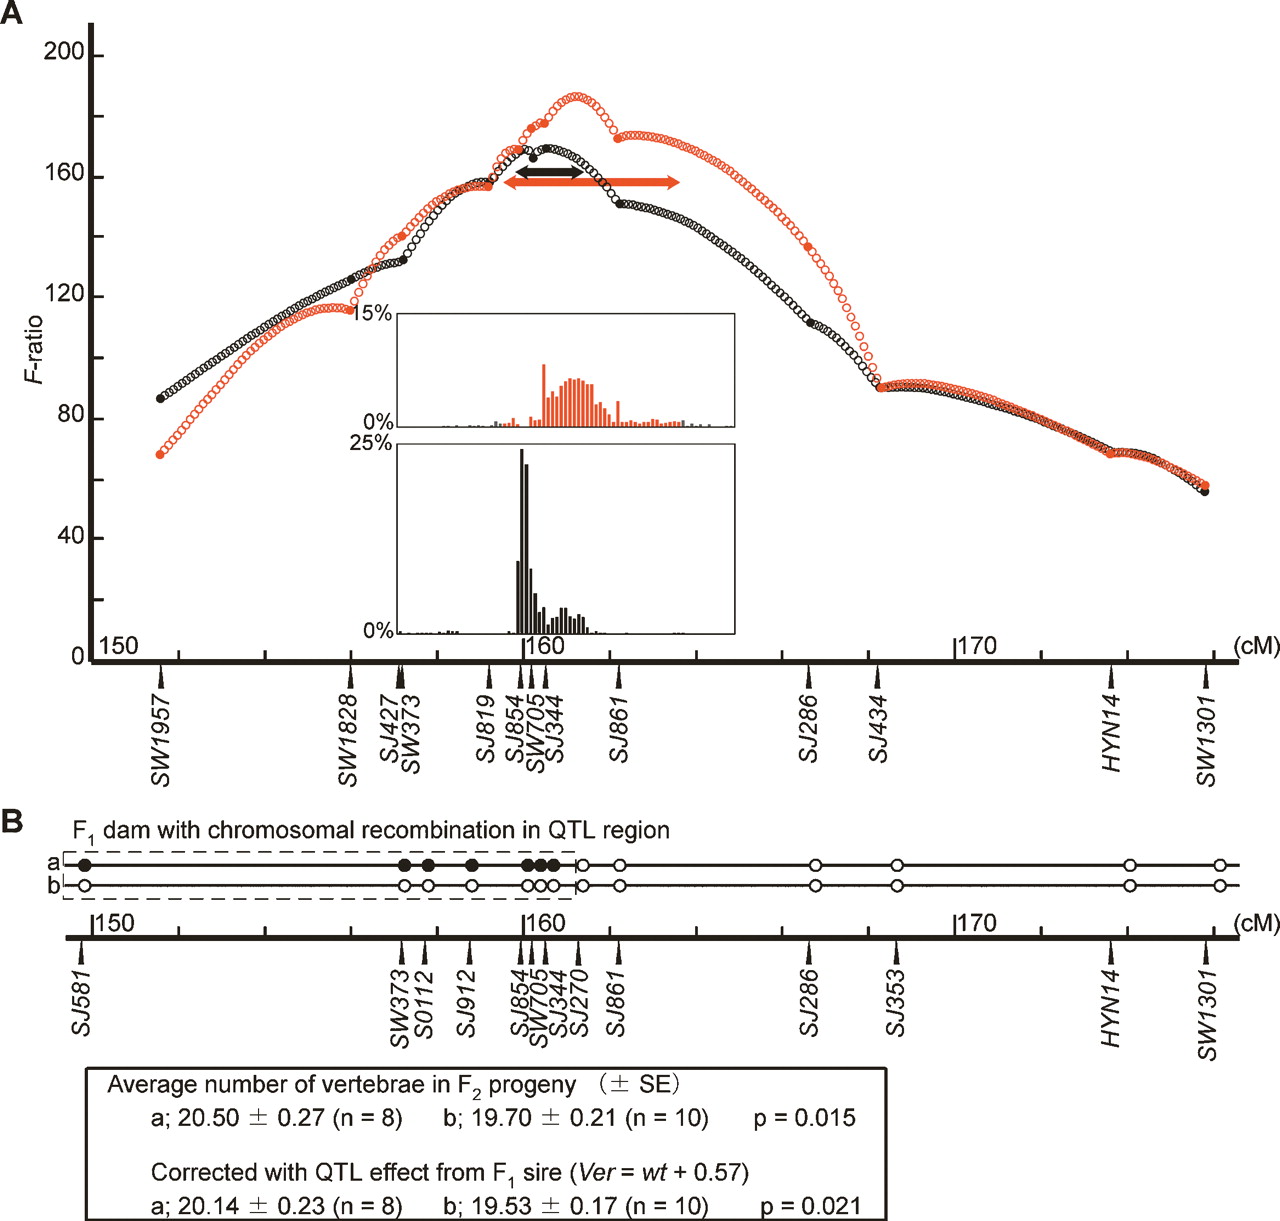
Dissection of a QTL region on SSC1 for vertebral number in F2 families. (A) Plots of F-ratio for interval mapping analyses in the Large White × Japanese wild boar population (red) and Jinhua × Duroc cross population (black). For the latter, the QTL effect on SSC7 was removed by incorporating the genotype of a marker in the QTL region into the model as a covariate. Bootstrap analysis (with 1000 repetitions) was performed to obtain the 95% confidence interval of the estimated QTL position on SSC1, and the results are shown in the inset bar graphs. Double-ended arrows indicate the 95% confidence interval in each population. (B) QTL type of an F1 dam with a recombination in the QTL region. The dam was from a Meishan × Göttingen miniature cross. Meishan pigs were wt/wt, and the Göttingen miniature was heterozygous (wt/Ver) at the QTL. Solid circles indicate alleles from the parental chromosome with the Ver alleles. Clear circles indicate alleles from the parental chromosomes with the wt allele. Average number of vertebrae was compared between two groups of F2 animals produced from the F1 dam, categorized according to transmitted chromosomes (indicated by a or b). Correction for the QTL effect from the F1 sire (Ver/wt) was also used. We assumed that the Ver allele increased the number of vertebrae by 0.57, an average effect in the experimental population in our previous study. (SE) Standard error.


