
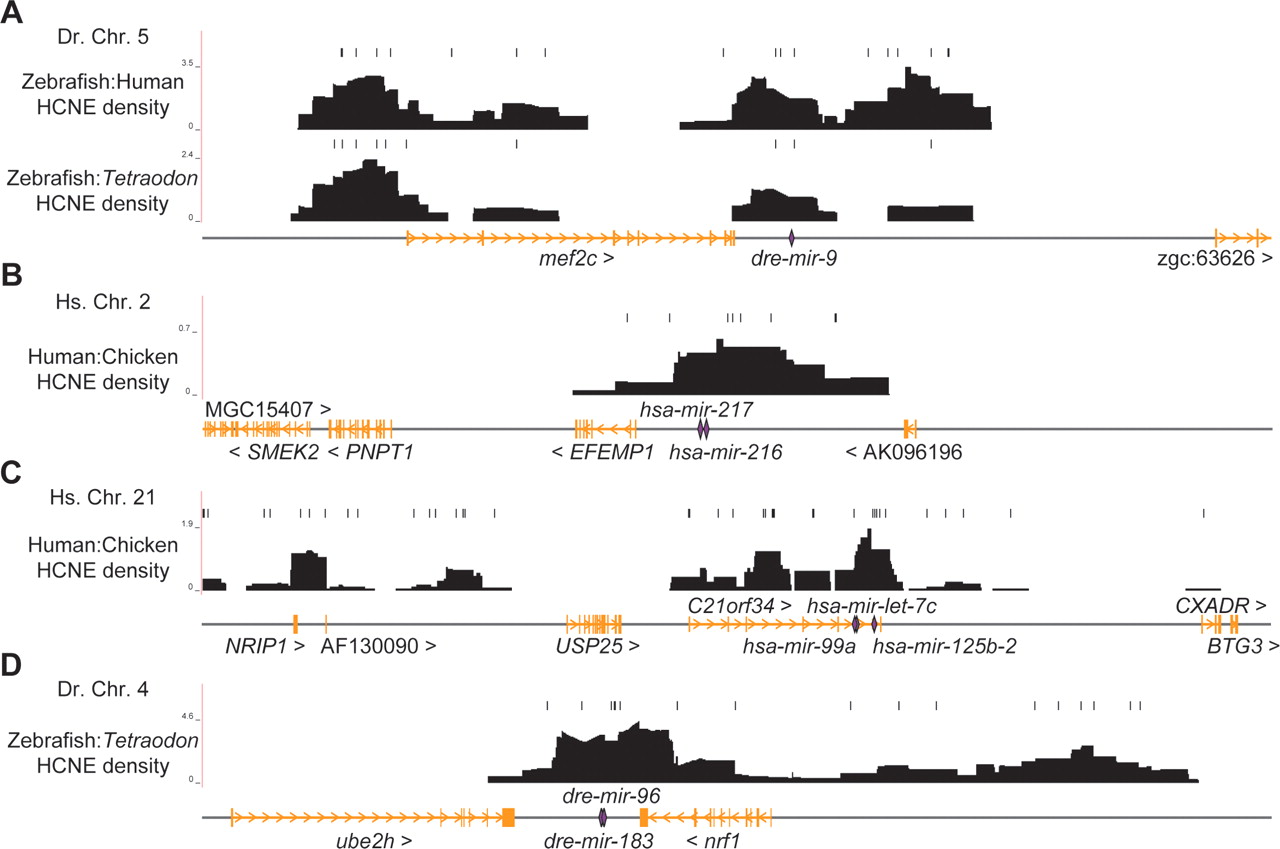
Density plots of HCNEs across human and zebrafish miRNA GRBs. HCNE density (black) often peaks near miRNAs (purple) in the vicinity of other genes (orange), suggesting miRNAs as HCNE target elements within GRBs. Density profiles calculated against species of different evolutionary distances separately identify the same hotspot for each region, but at different resolutions. The plots shown here are the most informative for each region. Our HCNE density score represents the number of bases within HCNEs determined by computational analysis (see Methods) divided by the number of non-exonic bases in sliding windows across zebrafish and human chromosomes (20-kb window, 100-bp step size and 100-kb window, 1-kb step size, respectively). The bars above density profiles represent HCNEs.


