
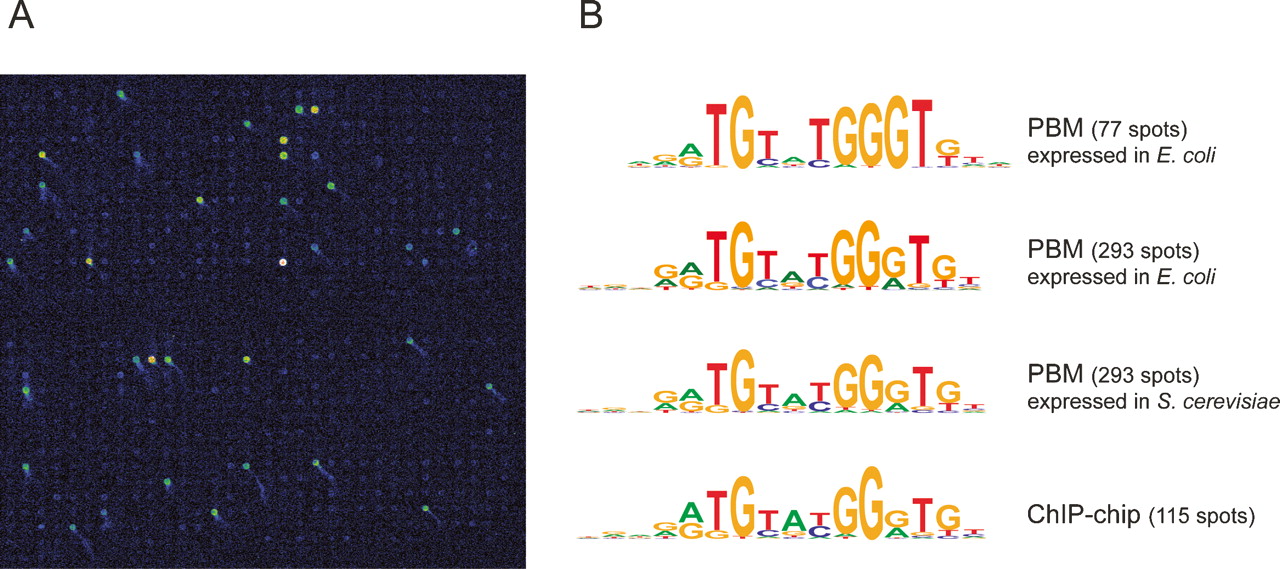
Whole-genome yeast intergenic microarray bound by S. cerevisiae Rap1. (A) Close-up view of a portion of a microarray spotted with all yeast intergenic regions, bound by Rap1 overexpressed in and purified from E. coli in high-throughput. Fluorescence intensities are shown in false color, with white indicating saturated signal intensity, yellow indicating high signal intensity, green indicating moderate signal intensity, and blue indicating low signal intensity. (B) Sequence logos for Rap1 DNA-binding site motifs determined from genomic DNA-binding site identification experiments. We previously performed a set of triplicate PBM experiments using Rap1 expressed in and purified from S. cerevisiae, resulting in 293 intergenic regions bound with a Bonferroni-corrected P value of 0.001 (Mukherjee et al. 2004). Here, as the data on Rap1 overexpressed in and purified from E. coli were generated by a single PBM experiment, fewer spots (77) met our significance threshold for binding. The top two motifs were derived from the 77 and 293 most significantly bound spots in the PBM shown in A. The third motif from the top was derived from our previous set of triplicate PBMs using Rap1 purified from S. cerevisiae (Mukherjee et al. 2004). The motif at the bottom was derived from all intergenic regions bound in vivo in ChIP-chip (Lee et al. 2002). Motifs were generated using BioProspector (Liu et al. 2001) and exhibited the following group specificity scores (top to bottom): 1.3 × 10−97, 2.4 × 10−207, 1.1 × 10−222, and 8.7 × 10−92.


