
Table 2.
Ne estimates from the European ancestry samples from HapMap (HM, n = 120) and Perlegen (PL, n = 46) estimates of fine-scale recombination rates (Method 2)
Click on table to view larger version.
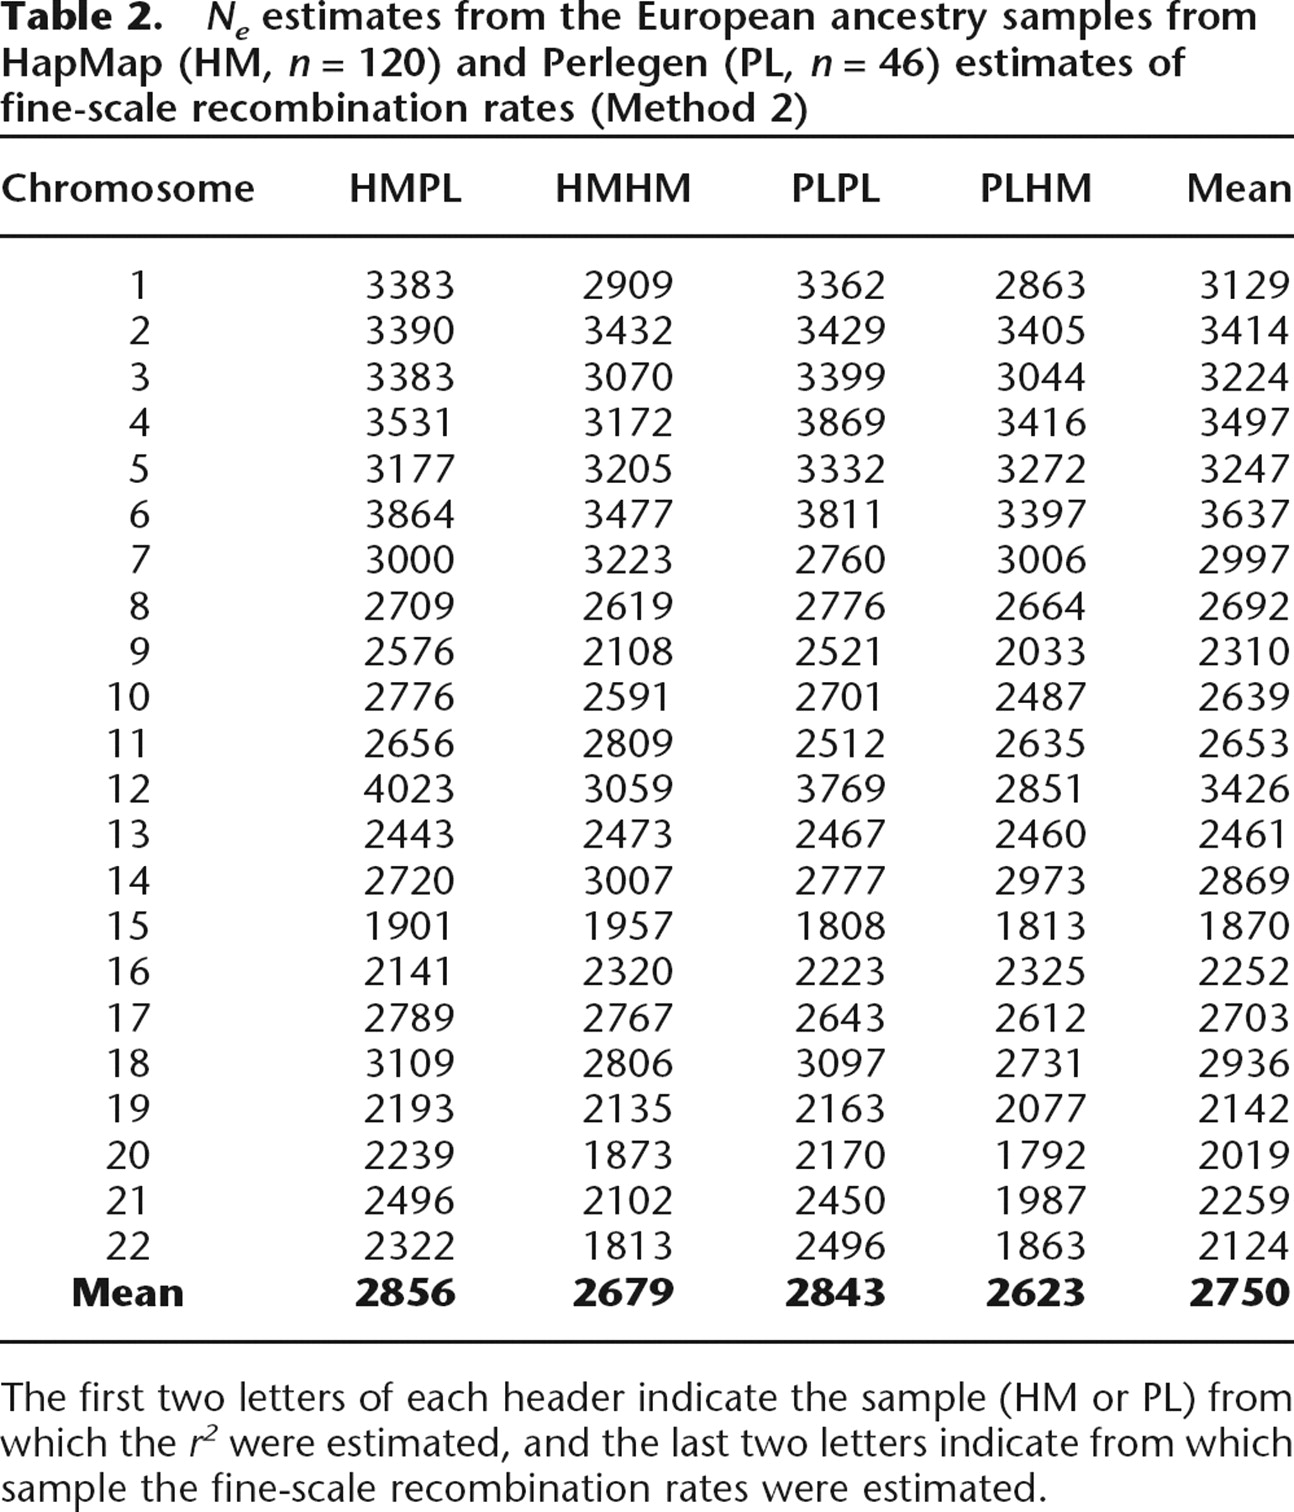
The first two letters of each header indicate the sample (HM or PL) from which the r2 were estimated, and the last two letters indicate from which sample the fine-scale recombination rates were estimated.


