
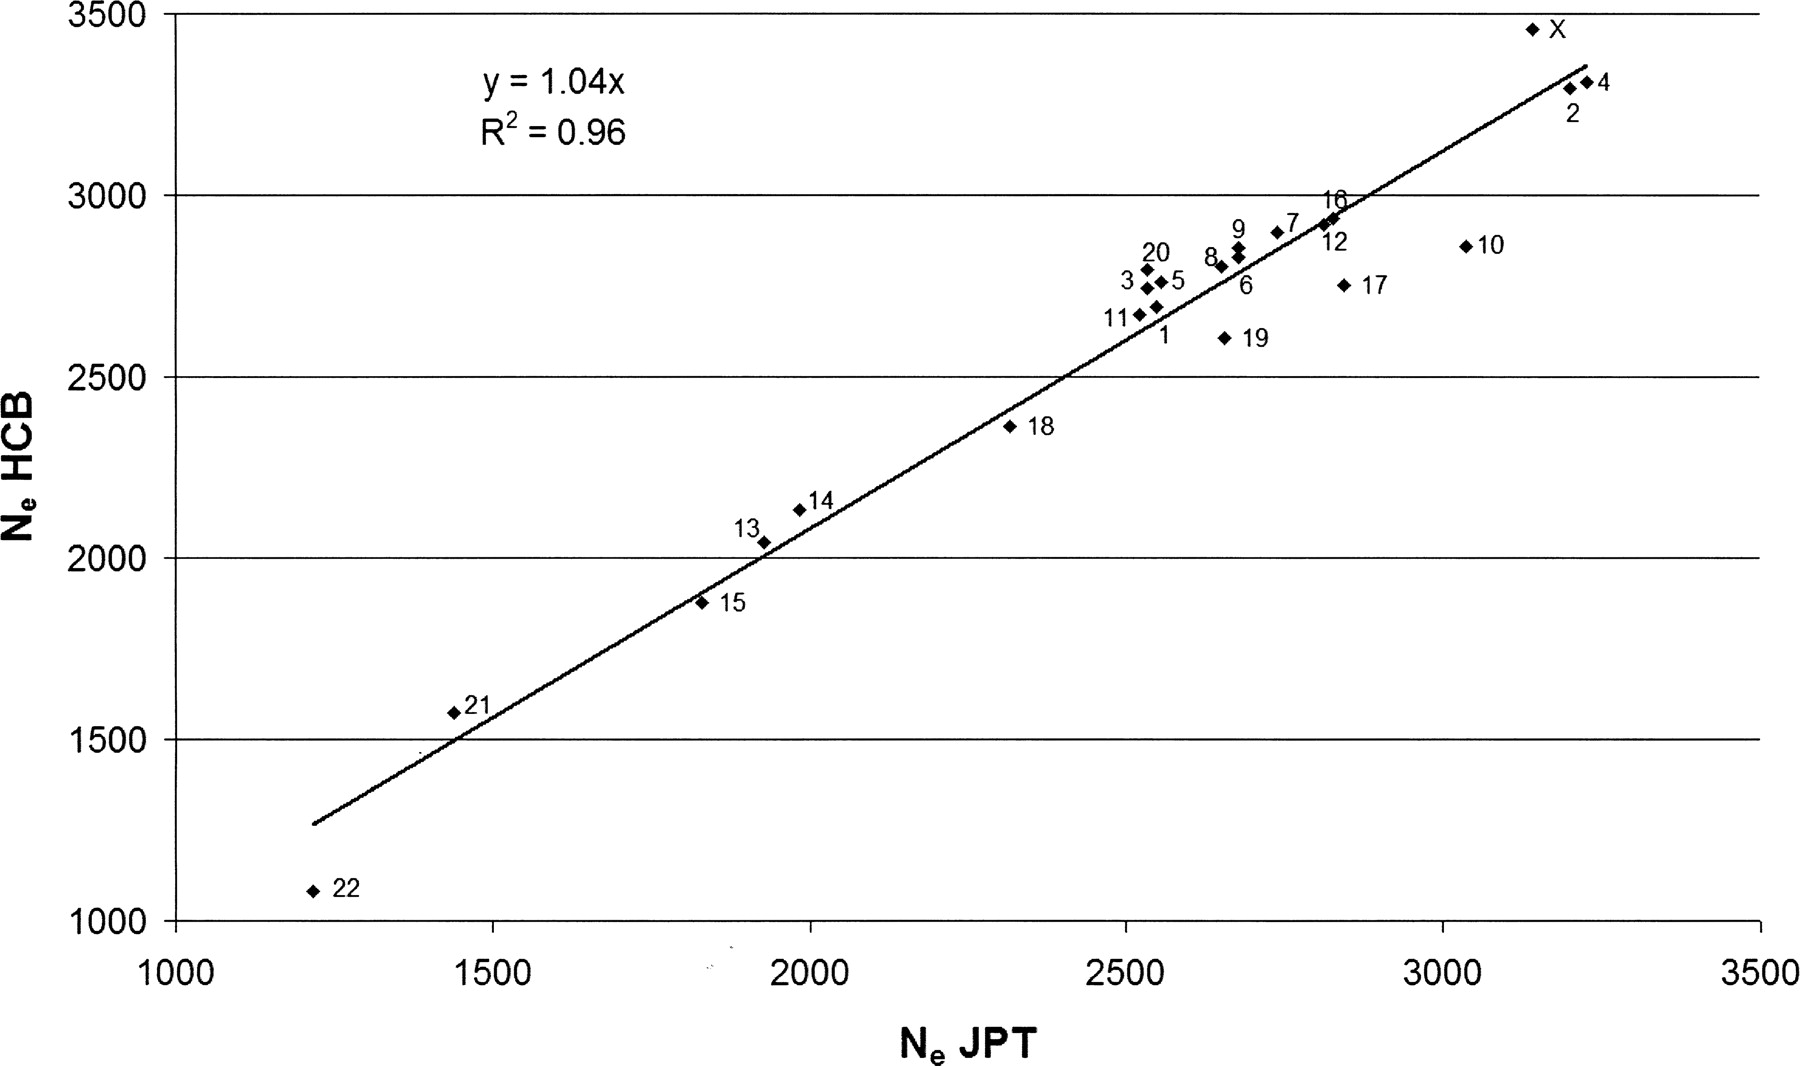
Figure 2.
Comparison of the estimate of Ne from each of the labeled 23 chromosomes for the JPT and HCB population (Method 1). The X-axis shows the effective population size for each autosome and the X chromosome estimated from the JPT sample using a nonlinear regression of r2 on physical distance between pairs of SNPs. The Y-axis shows the estimates of Ne for each chromosome from HCB sample. The fitted linear regression line fits nearly perfectly, presumably reflecting common ancestry of the two populations.


