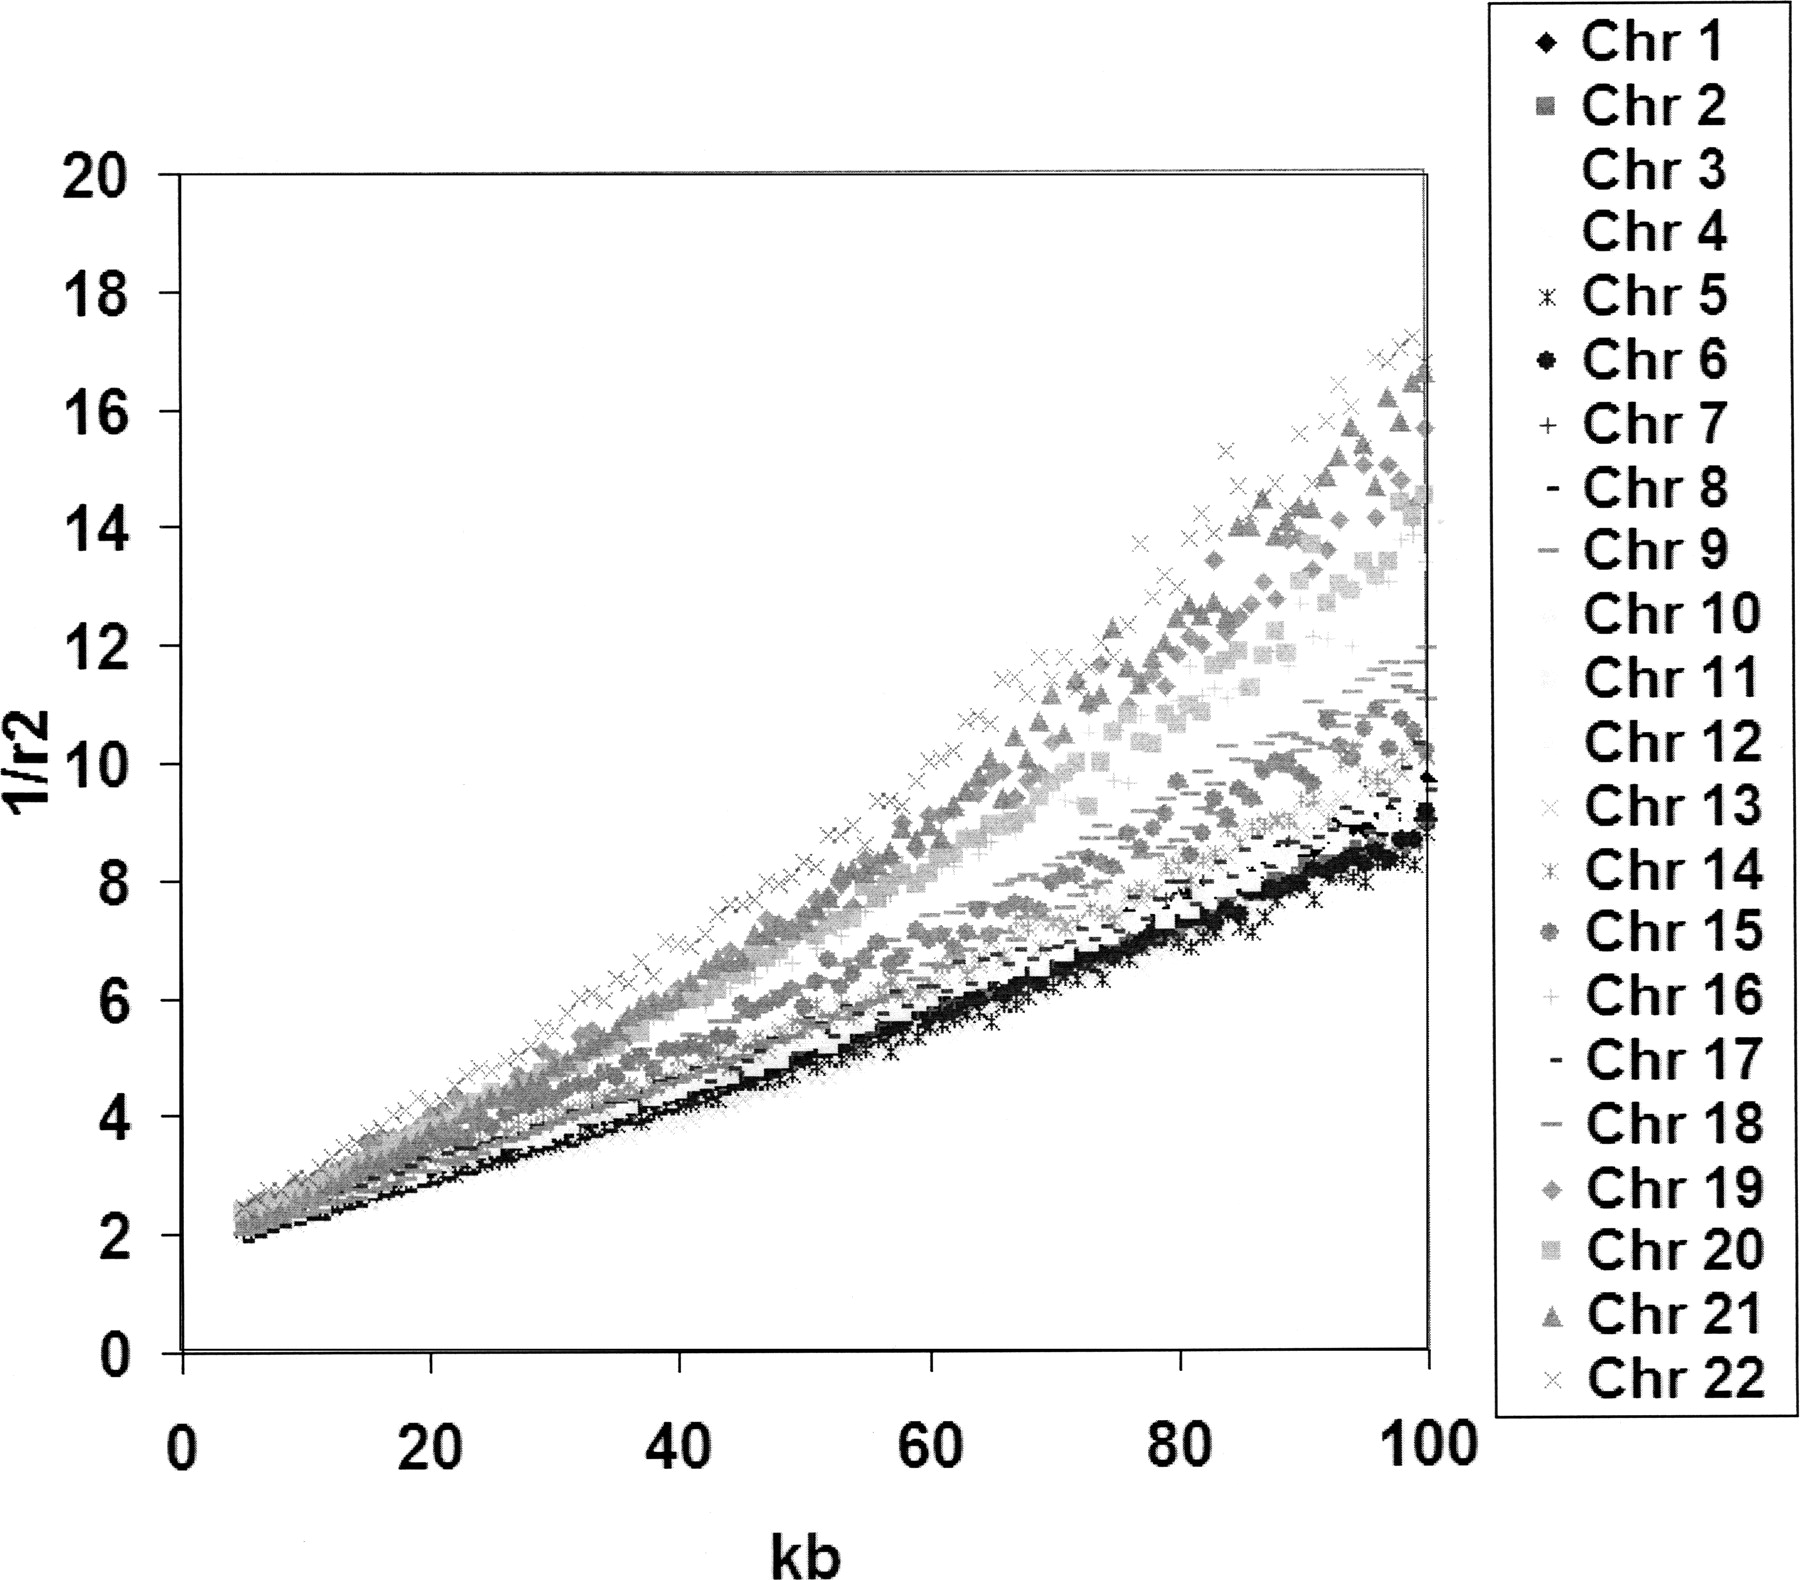
Recent human effective population size estimated from linkage disequilibrium

(Downloading may take up to 30 seconds. If the slide opens in your browser, select File -> Save As to save it.)

Click on image to view larger version.

Figure 1.
Figure 1.

Reciprocal of r2 plotted against physical distance for each of the 22 autosomes for the CEU population. The X-axis shows the physical distance in kilobases and the Y-axis shows 1/mean(r2). The mean value of r2 was calculated in 1 kb bins.

This Article

  1. Genome Res. 17: 520-526

Preprint Server