
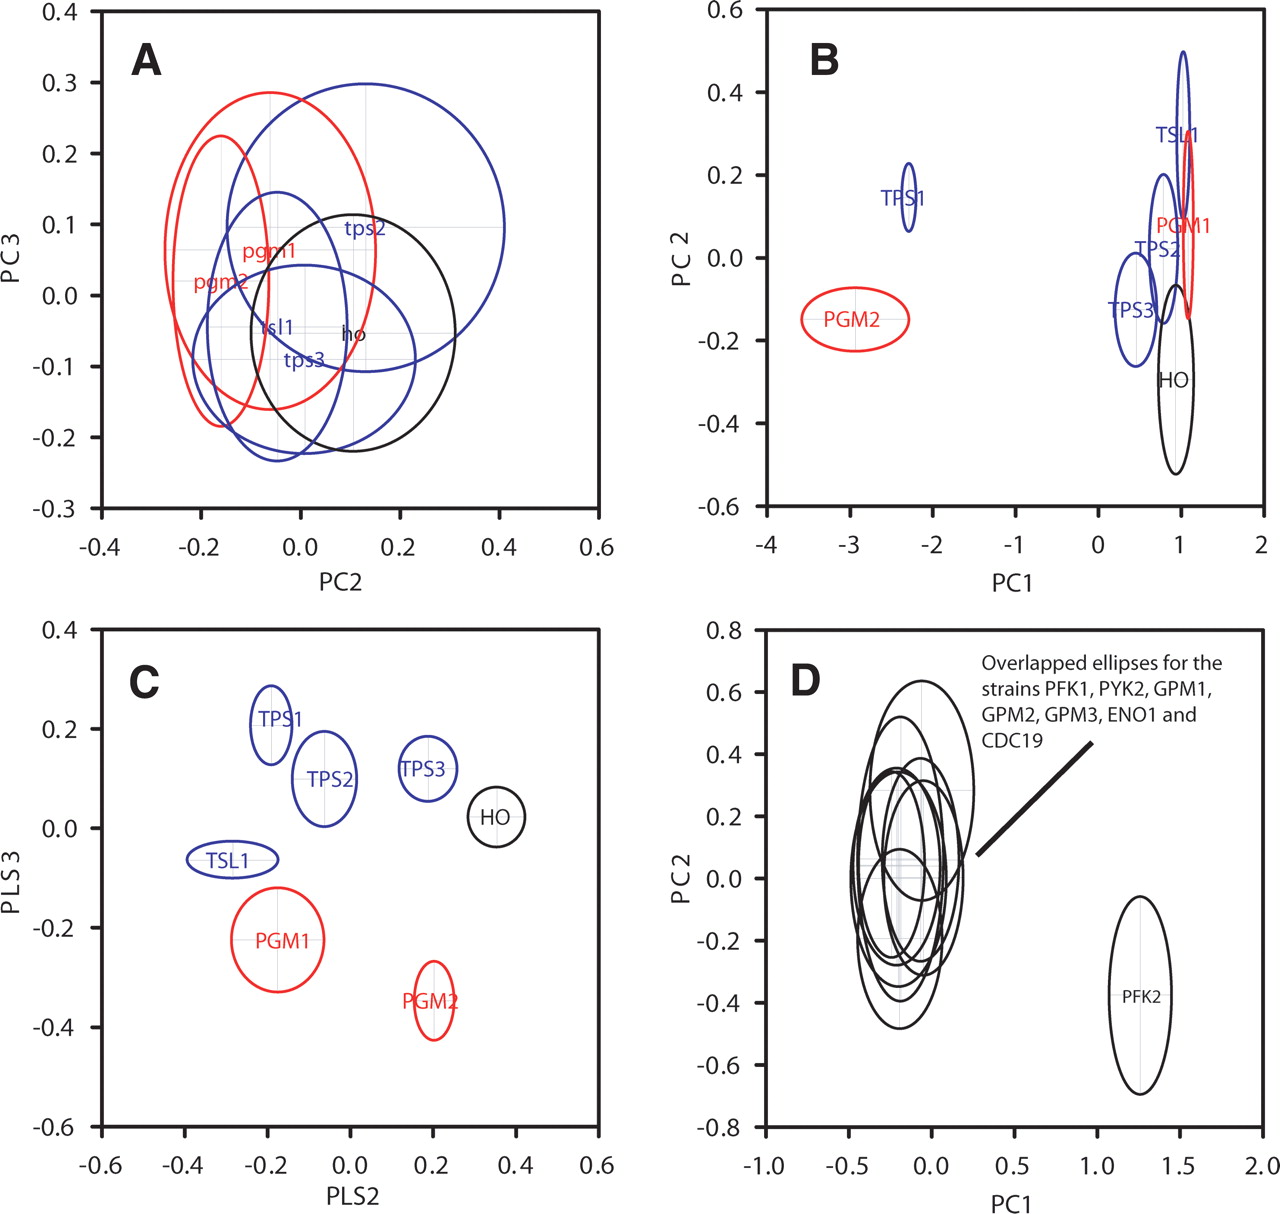
PCA and projection to latent structures (PLS) discriminant analysis scores plots for the extracellular metabolite profiles of strains deleted for genes involved in trehalose metabolism or in glycolysis. (A) PC2 vs. PC3 scores plot for six trehalose mutants grown on minimal medium with glucose as sole carbon source (TPS2, TPS3, and TSL1; blue); (PGM1 and PGM2, defined by FCA to belong to a different coupled unit, red) (11–12 replicate samples for each strain). PC1 was correlated with total spectral intensity (prior to normalization) and is not shown. (B) PCA scores plot (PC1 vs. PC2) for trehalose mutants grown on galactose as sole carbon source, same strains as shown in panel A with the addition of tps1Δ. Reduced growth rates for the tps1Δ and pgm2Δ mutants are reflected in their separation from the other strains along PC1, which was correlated with total spectral intensity (prior to normalization) (seven to 12 replicate samples for each strain). (C) PLS scores plot (axis 2 vs. axis 3) for trehalose mutants grown on galactose as sole carbon source. PLS axis 1 separated the tps1Δ and pgm2Δ mutants from the other strains, and was correlated with total spectral intensity. (D) PCA scores plots (PC1 vs. PC2) for glycolysis mutants (nine to 12 replicate samples for each strain). pfk2Δ is clearly separated from the other strains along PC1 (no other differences between strains were found on lower components, either from PCA or from PLS discriminant analysis).


