
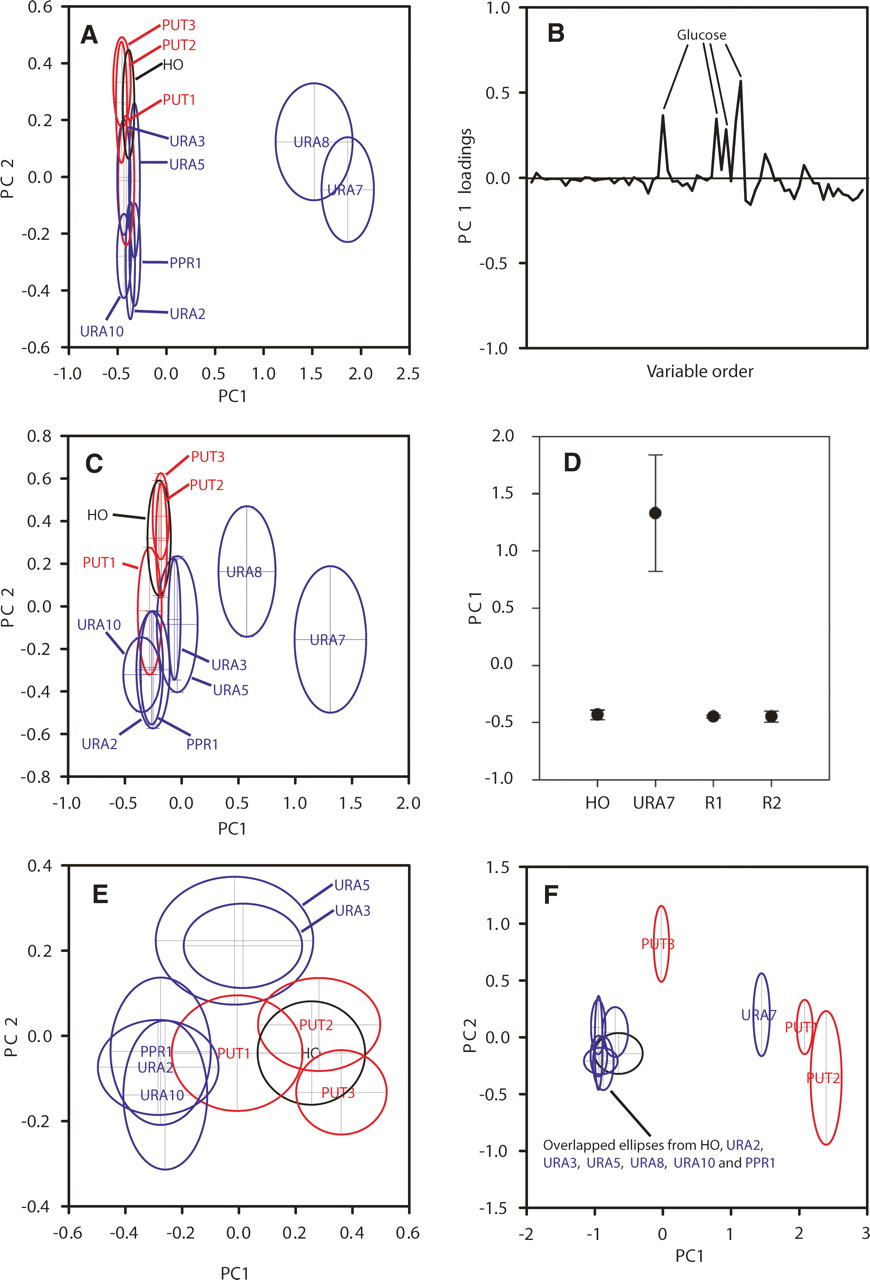
PCA scores plots for the extracellular metabolite profiles. (A) PC1 vs. PC2 scores plot for three mutations affecting genes in proline utilization (PUT1, PUT2, and PUT3; red), seven mutations affecting genes in pyrimidine biosynthesis (URA2, URA3, URA5, URA7, URA8, URA10, PPR1; blue), and a control gene (HO, black) (eight replicate samples for each strain). (B) Loadings plot for the PC1 axis shown in panel A. (C) PC1 vs. PC2 scores plot for the data shown in panel A, recalculated after removing variables containing NMR signals from glucose. (D) Scores plot (PC1) showing that reintroduction of functional URA7 restores a wild-type (hoΔ) metabolic phenotype. (R1) ura7Δ strain with chromosomal reinsertion of URA7 under control of its native promoter, (R2) ura7Δ strain with chromosomal reinsertion of URA7 and its native terminator under control of the native promoter. (E) PC1 vs. PC2 scores plot for the data shown in panel A, recalculated after excluding the ura7Δ and ura8Δ samples. (F) PC1 vs. PC2 scores plot of the same strains grown on minimal medium containing proline rather than ammonium as a nitrogen source (five to six replicate samples for each strain).


