
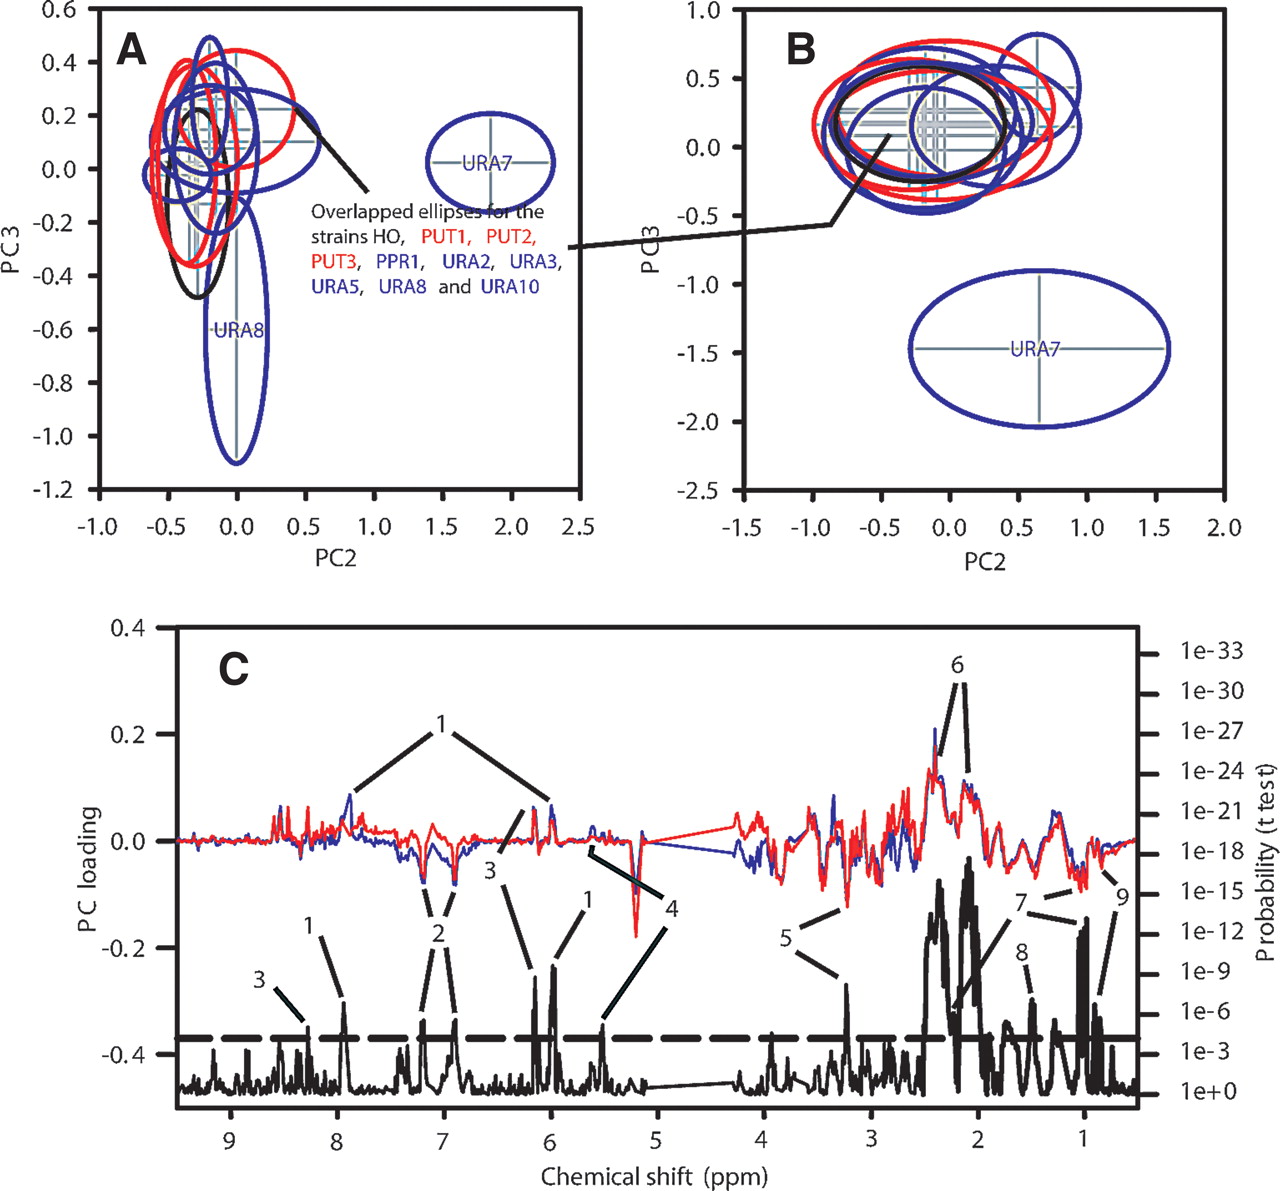
Principal Components Analysis (PCA) scores plots for cell extracts. The center of each ellipse indicates the mean, and the margin indicates one standard deviation. The cells were grown on minimal medium containing uracil. (A) PC2 vs. PC3 scores plot for three mutations in genes affecting proline utilization (PUT1, PUT2, and PUT3; red), seven mutations in genes affecting pyrimidine biosynthesis (URA2, URA3, URA5, URA7, URA8, URA10, PPR1; blue), and a control gene (HO, black) (four to six replicate samples for each strain). PC1 was correlated with sample OD and is not shown. (B) Scores plot for the same 11 strains grown on minimal medium containing uracil and on minimal medium containing orotate (eight to 13 replicate samples for each strain). PC1 was correlated with sample OD and is not shown. (C) Loadings plot showing the variables responsible for separation of the ura7Δ mutant. (Blue line) PC 2 loadings from the PCA model shown in panel A, (red line) PC 3 loadings from the PCA model shown in panel B, (black line) probability of significant difference between these variables for the ura7Δ and hoΔ samples (data from both the orotate and uracil cultures were used; t-test, where for the two groups n = 24 and 13, respectively), (dashed line) threshold for statistical significance, adjusted in accordance with the Bonferroni criterion. Metabolites labeled directly on the plot: (1) uridine/cytidine nucleotides, (2) tyrosine, (3) adenine nucleotides, (4) possibly a phosphosugar, (5) choline metabolites, (6) glutamate, (7) valine, (8) alanine, (9) isopropylmalate.


