
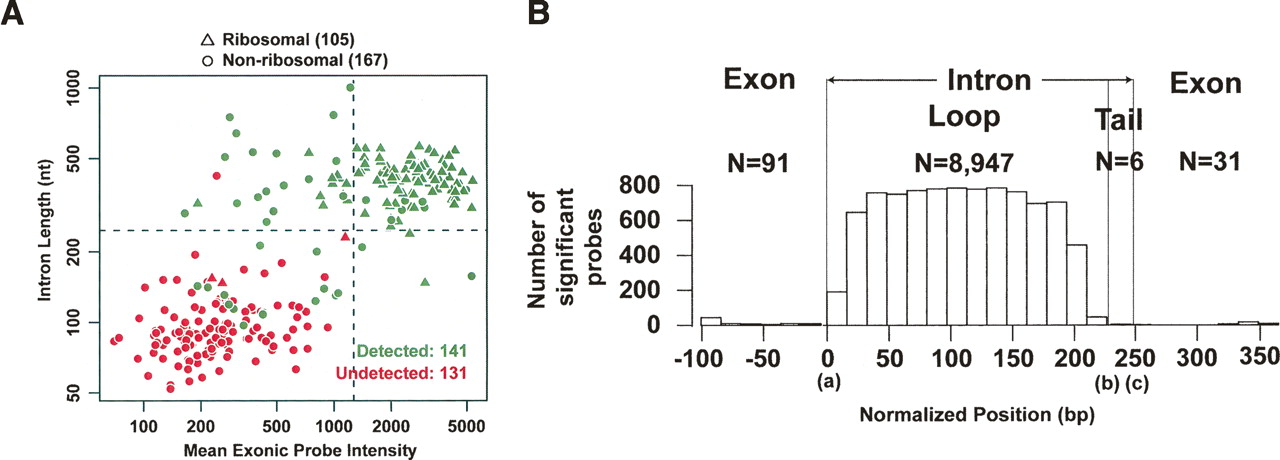
Figure 3.
(A) Relationship between gene expression, intron length, and intron detection. Intron-containing genes were categorized as ribosomal (105) and nonribosomal (167); (green) detected introns, (red) undetected introns; (black dashed lines) mean intron length (246 nt) and mean exon probe intensity (1269). (B) Coverage of intronic regions by tiling array probes. Normalized positions of tiling array probes are plotted. (a) 5′ splice site, (b) branchpoint, (c) 3′ splice site.


