
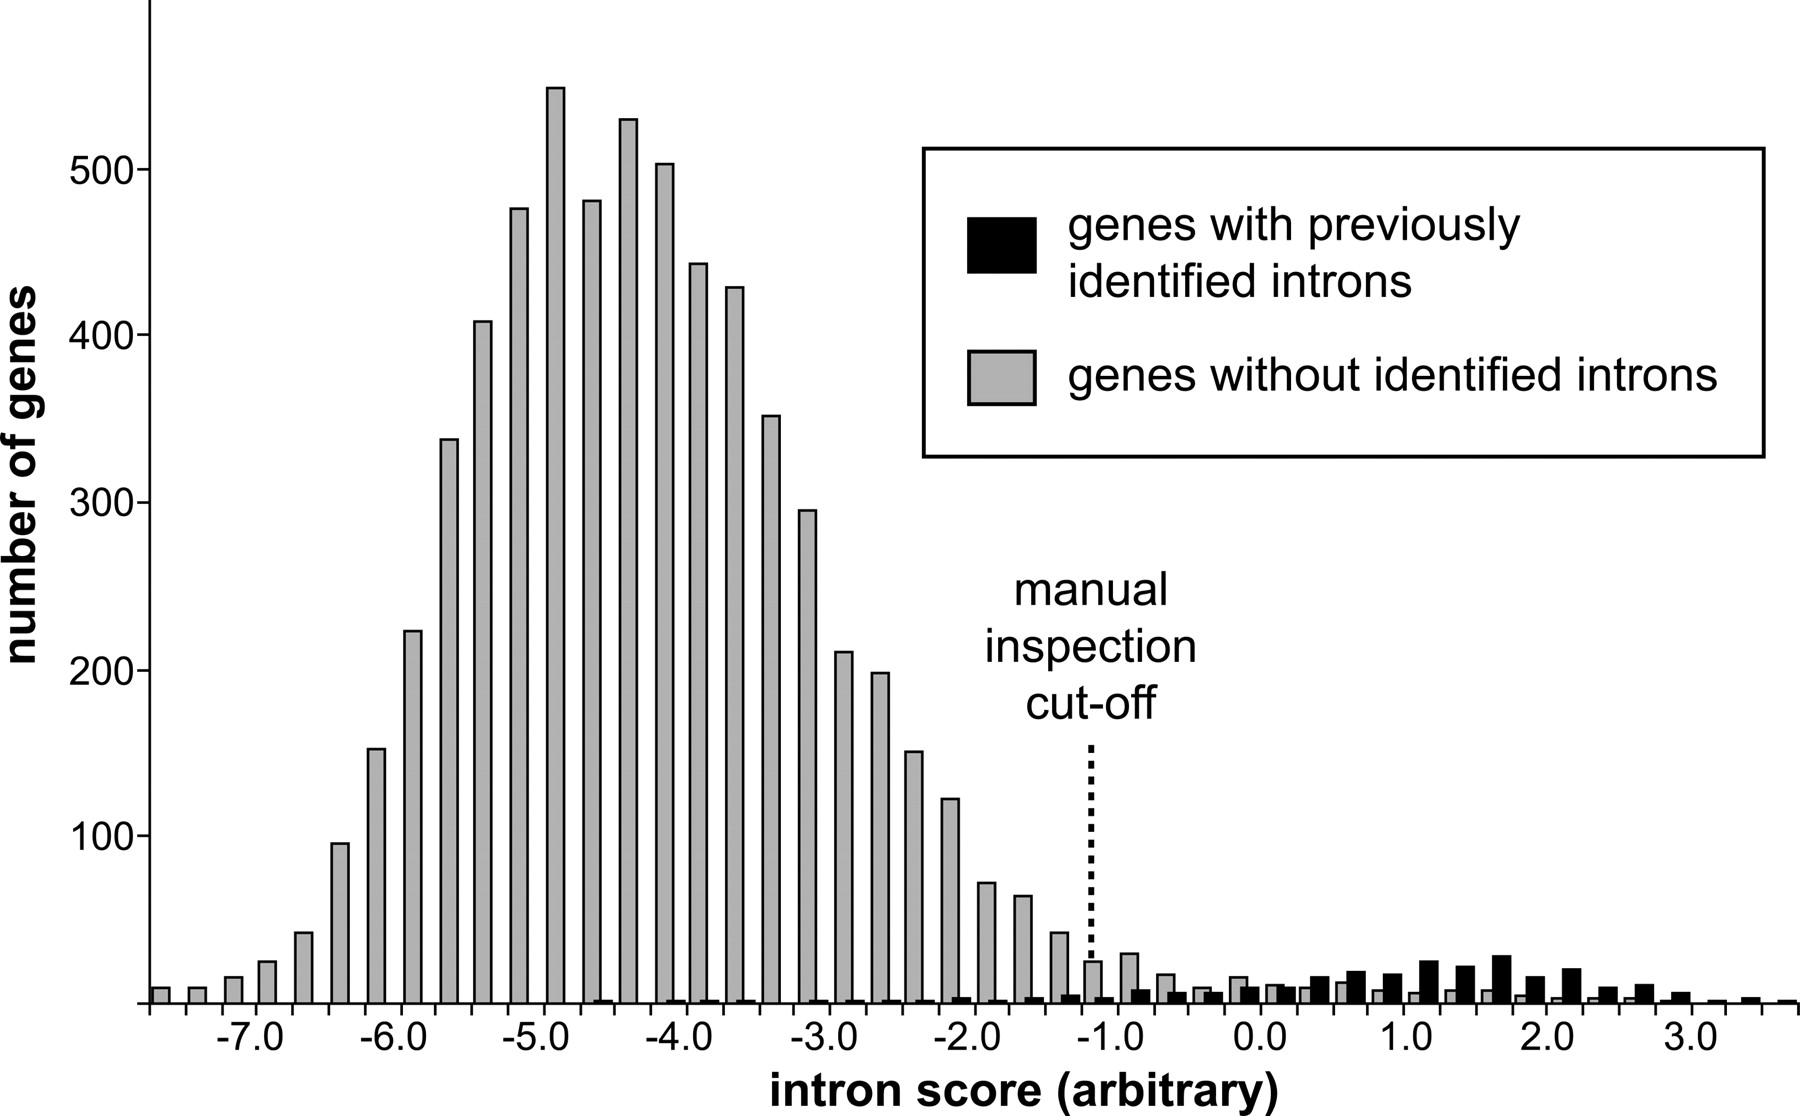
Figure 3.
Distribution of computational intron scores. The histogram depicts the distribution of intron scores among all genes in our genomic data set. Scores are in arbitrary units, with higher numbers indicating a higher likelihood that a given gene contains an intron. Whether or not a gene is represented as containing a known intron reflects its status prior to our computational screen. (Dashed line) The cutoff used to define our set of candidate intron-containing genes.


