
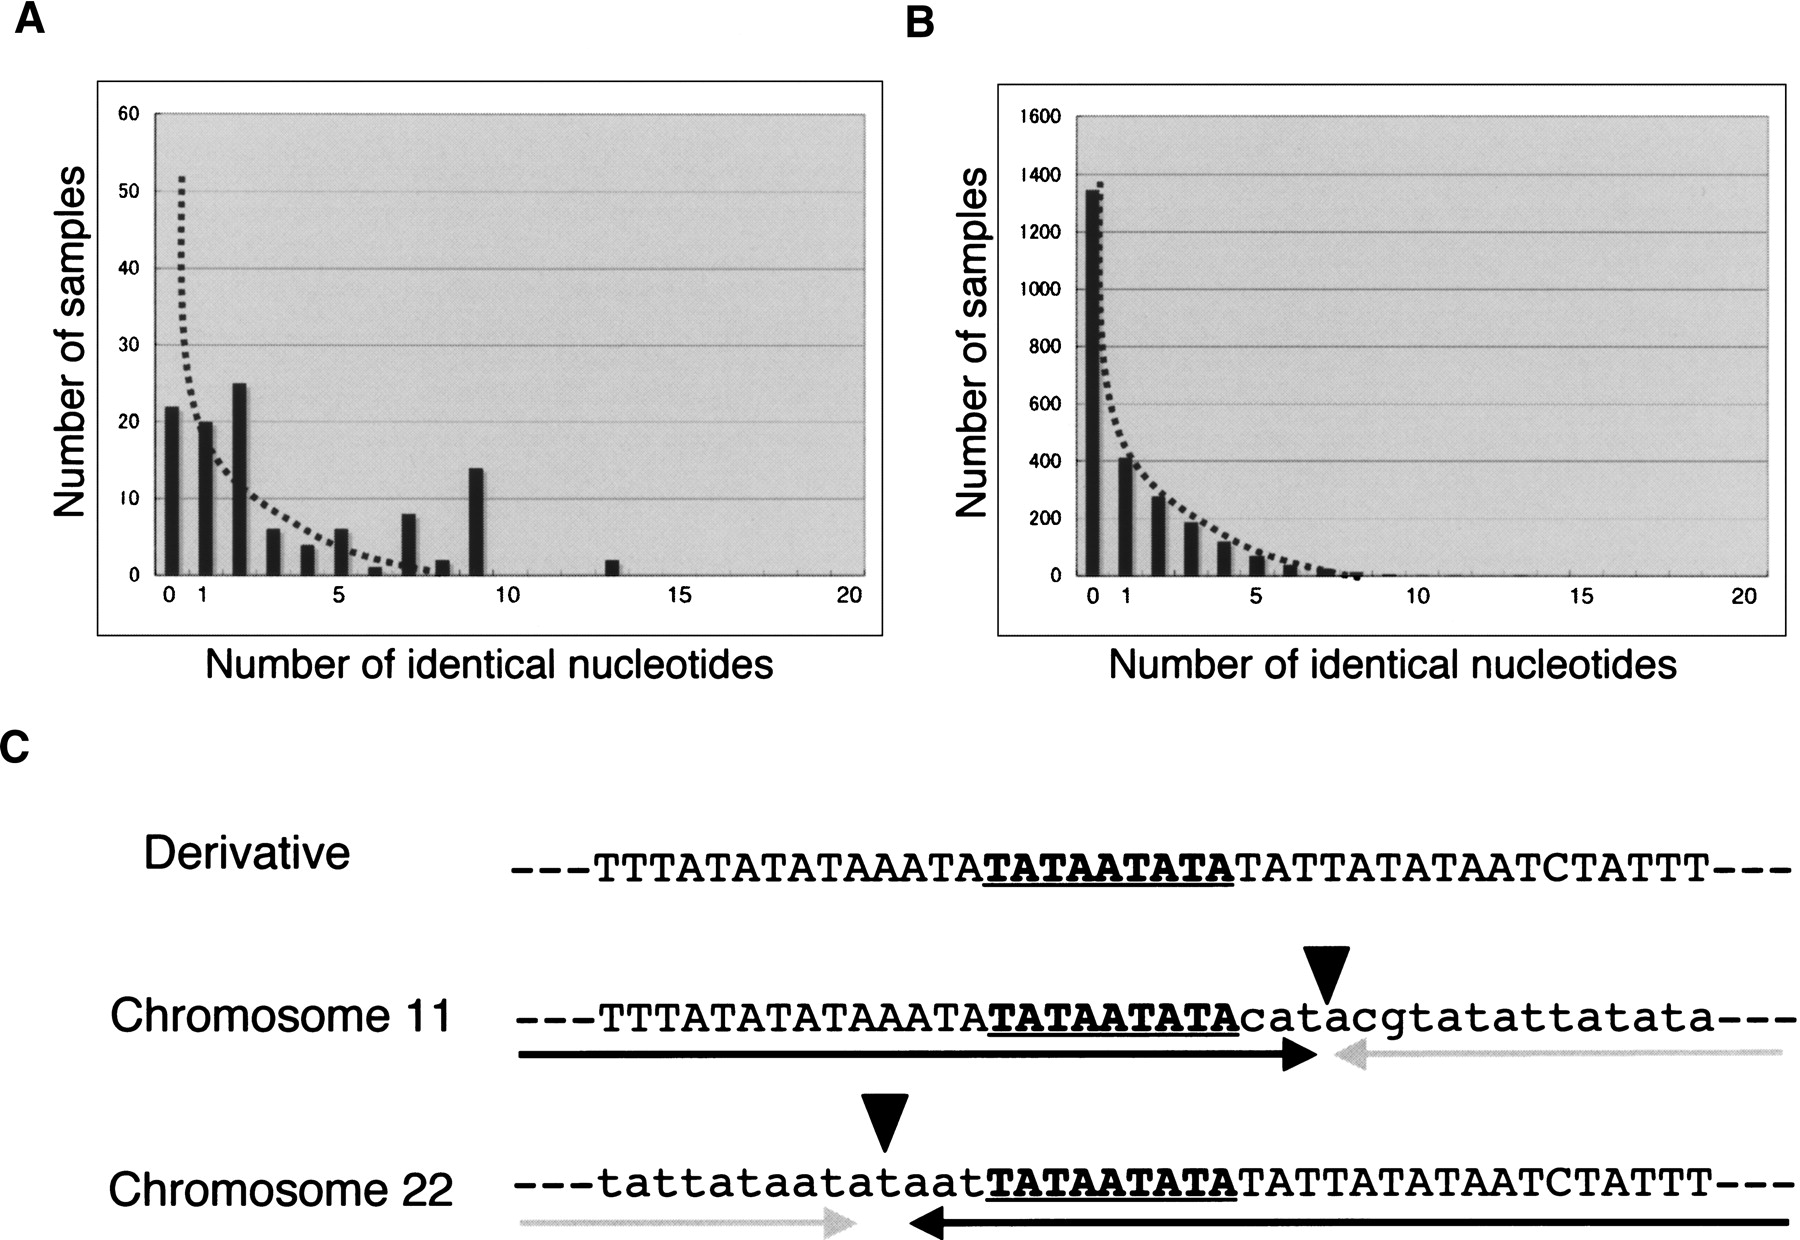
Analysis of microhomologies at the breakpoints. (A) The number of identical nucleotides at the breakpoints of the t(11;22). The dotted line indicates the putative sample numbers from simulation of NHEJ. (B) A random simulation of the translocation. The details of the procedure are given in the Methods. The scale of the vertical axis is adjusted to reflect sample number relative to that shown in the graph (A). (C) Detail of one junction showing nine identical nucleotides (Case 3). The top indicates the junction fragment, while the middle and bottom indicate original breakpoint sequences. The arrows indicate each unit of the inverted repeats, while the arrowheads indicate the center of the PATRR.


