
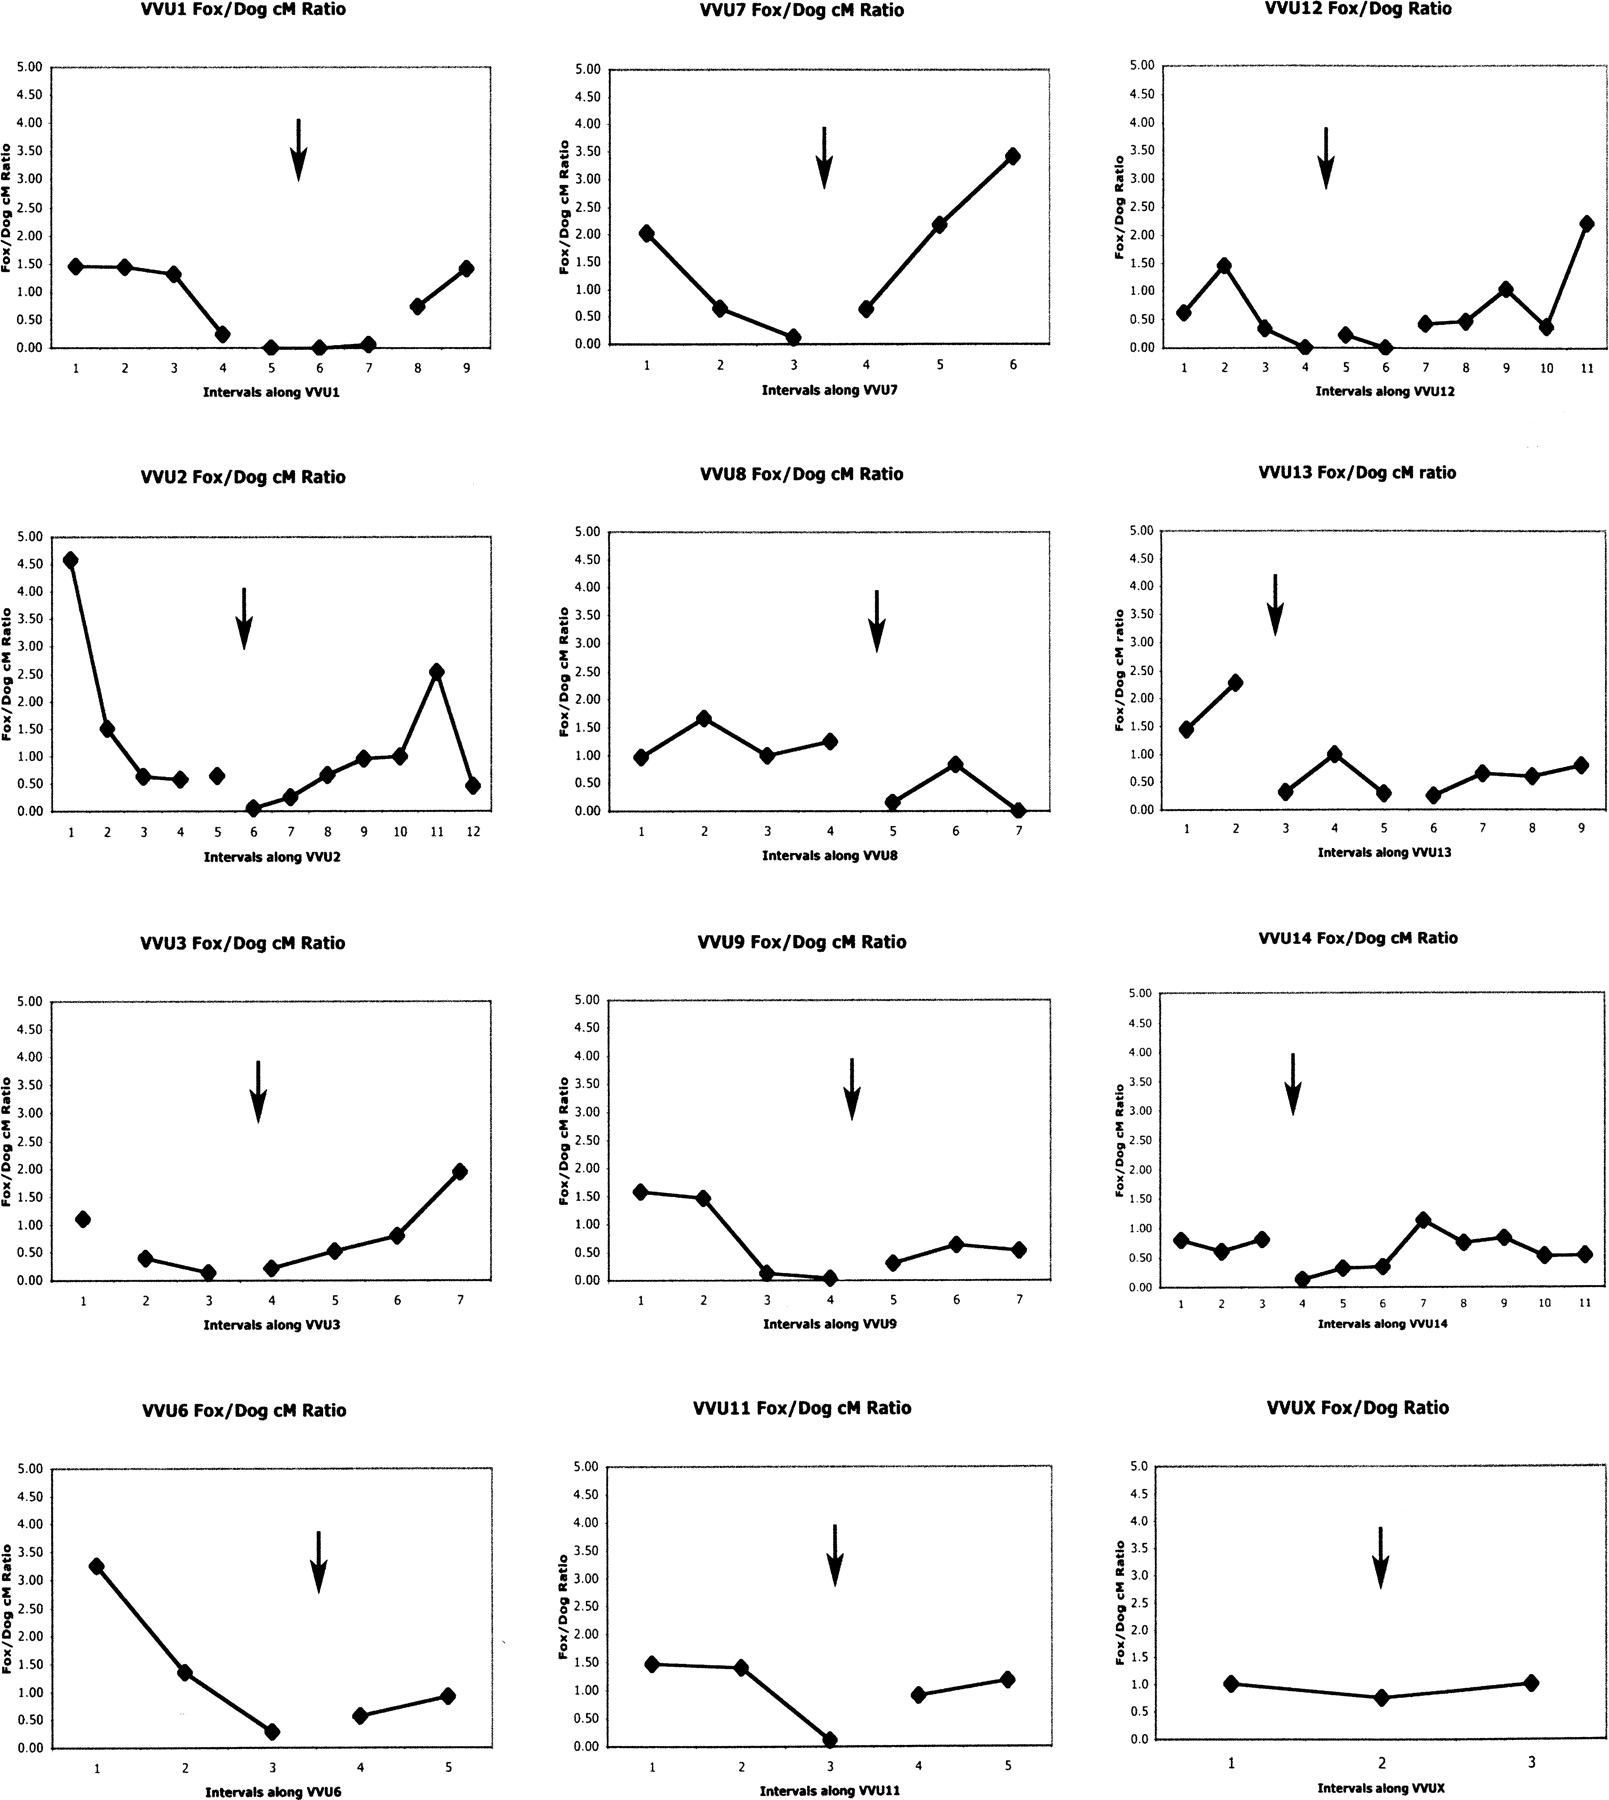
Figure 2.
Comparisons of recombination rates between fox and dog chromosomes. Each point on the graph represents the ratio (fox to dog) of the recombination distances between a pair of markers mapped in both the fox and the dog (fox and dog distances between these markers and recombination ratios are presented in Supplemental Table 2). Points connected by a line correspond to a single dog chromosome. Arrows indicate putative centromere positions of fox chromosomes. Relative recombination suppression (ratio <1.0) is evident in the pericentromeric region of several fox chromosomes.


