
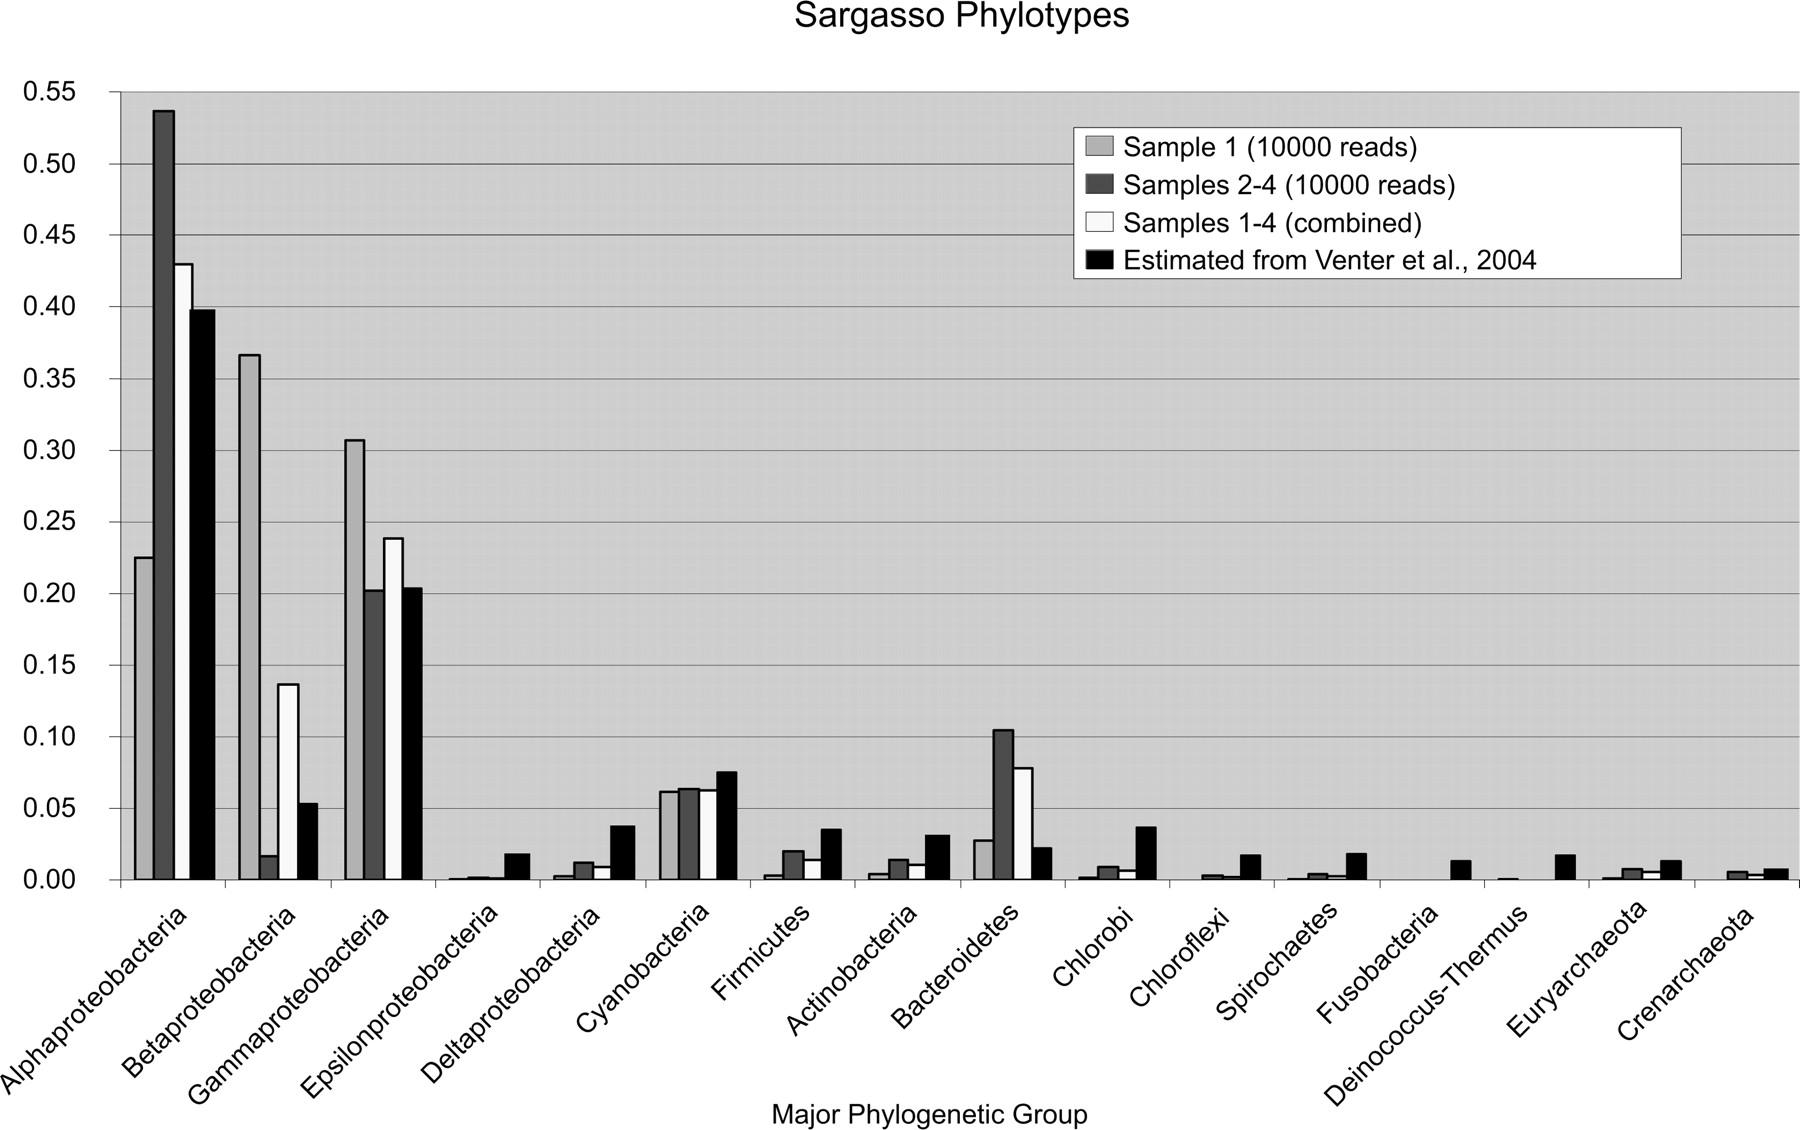
Figure 4.
The distribution of reads from Sample 1, pooled Samples 2–4, and the weighted average of these two data sets, over 16 major phylogenetic groups, as computed by MEGAN. For the sake of comparison, the diagram also shows the relative contribution of organisms to these groups, as estimated from Venter et al. (2004) by averaging over the values for all six genes that are reported there.


