
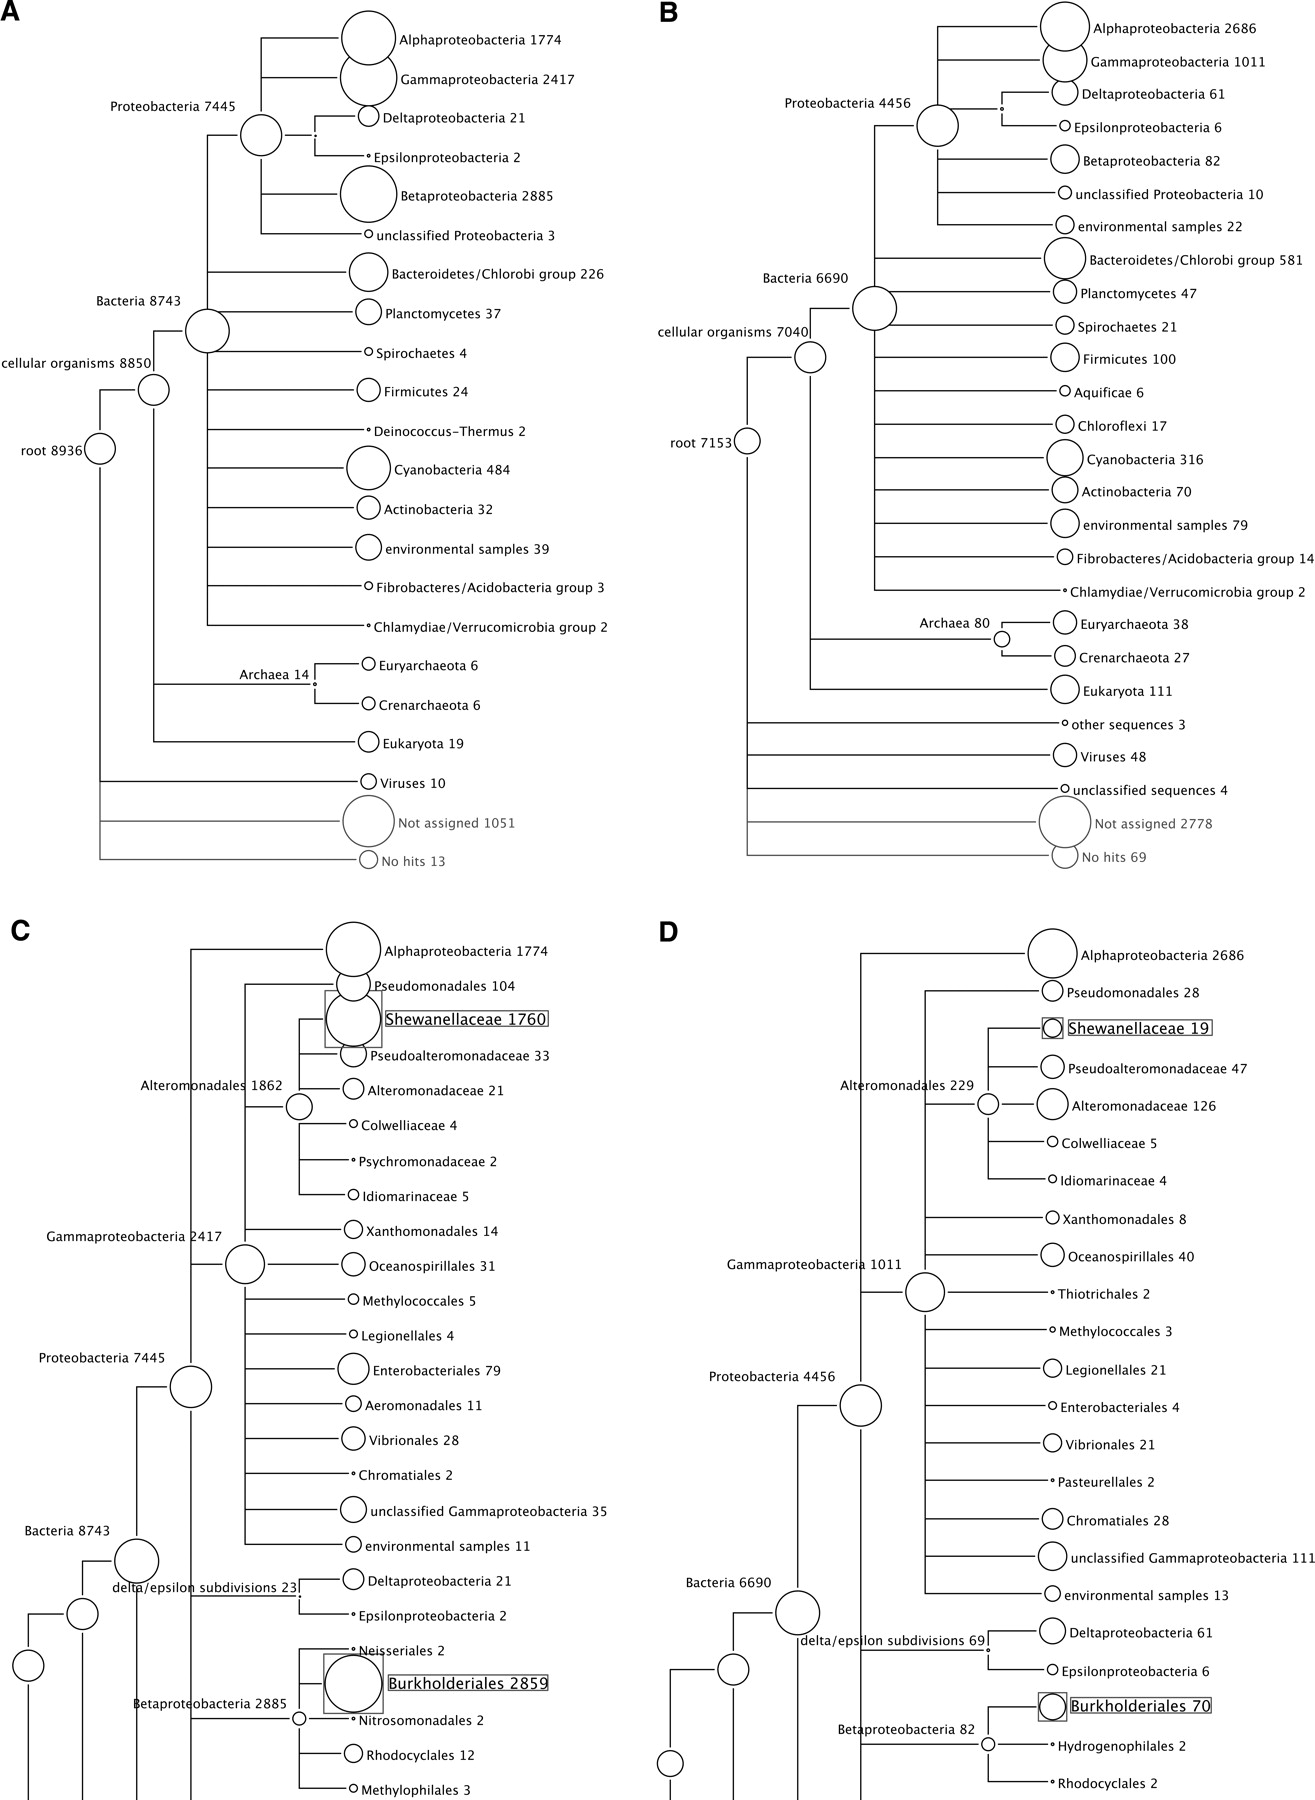
Phylogenetic diversity of the Sargasso Sea sequences computed by MEGAN. The microheterogeneity of Sample 1 was investigated by comparing it to pooled Samples 2, 3, and 4 (Venter et al. 2004). (A) Analysis of 10,000 reads randomly chosen from Sample 1. (B) Analysis of 10,000 reads randomly chosen from Sample 2. (C,D) A more detailed view of Sample 1 and Samples 2–4, respectively, illustrating a significant difference of relative frequencies of Shewanella and Burkholderia species in the two data sets. In all such figures, each circle represents a taxon in the NCBI taxonomy and is labeled by its name and the number of reads that are assigned either directly to the taxon, or indirectly via one of its subtaxa. The size of the circle is scaled logarithmically to represent the number of reads assigned directly to the taxon.


