
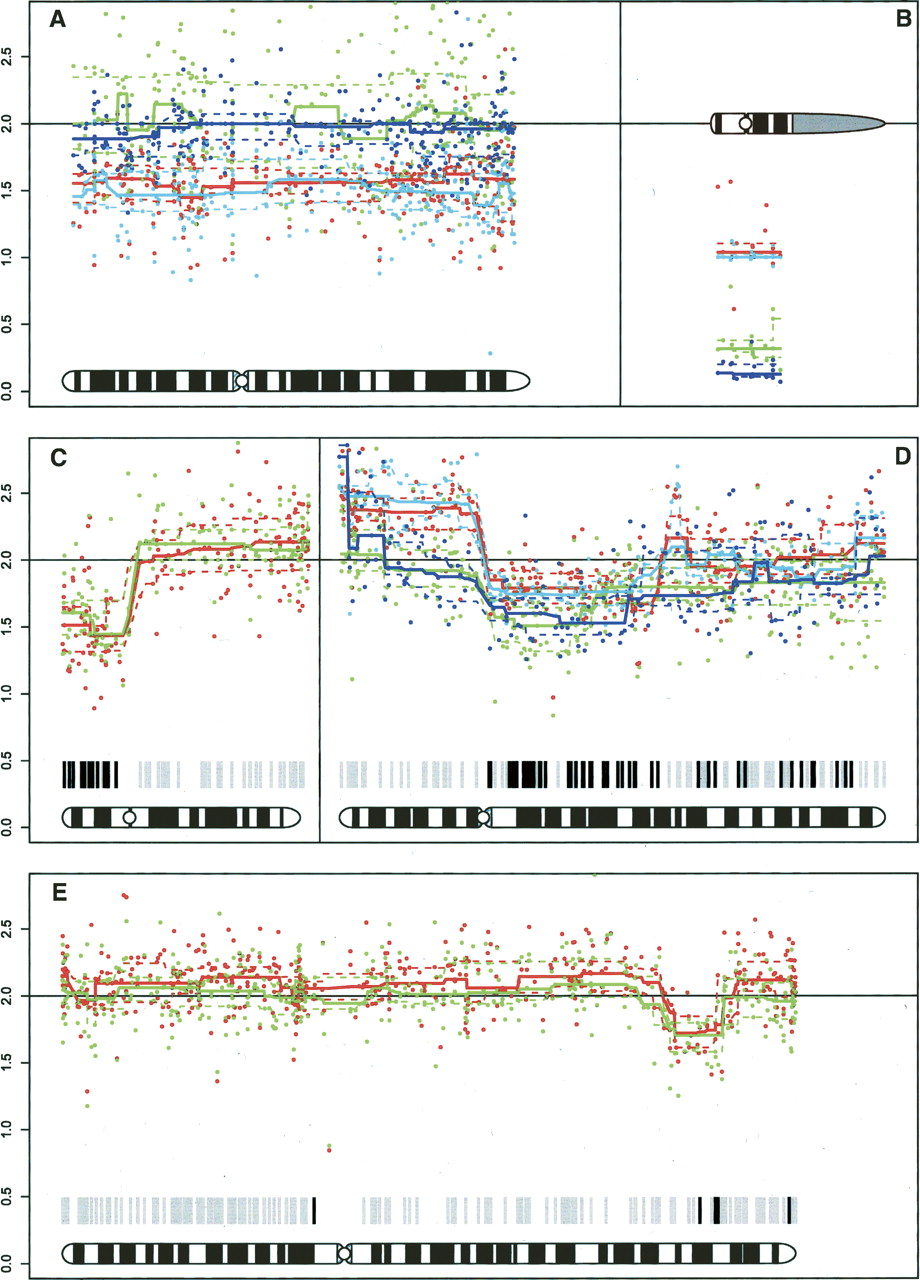
Chromosomal plots from BeadArrays. Each panel depicts the smoothed copy number as a continuous line and the 10th and 90th percentiles as dashed lines. The unsmoothed copy number values are shown as dots. (A,B) X- and Y-chromosome from leukocyte DNA. Red, 44 male; blue, 106 female; cyan, 108 male; green, 514 female. (C–E) Comparisons of copy numbers. The green lines depict FFPE tumor tissue, and the red lines depict fresh frozen tumor tissue. Bars below the plot indicate heterozygous SNPs in the corresponding normal sample. At black bars, the SNP has switched to homozygosity in the tumor. Physical loss is called when the upper percentile line drops below 2; gain is called when the lower percentile line exceeds 2. (C) Chromosome 17 in tumor 106. (D) Chromosome 5 in tumor 44. Blue line, FFPE BAC array; cyan line, fresh frozen BAC array. (E) Chromosome 2 in tumor 514.


