
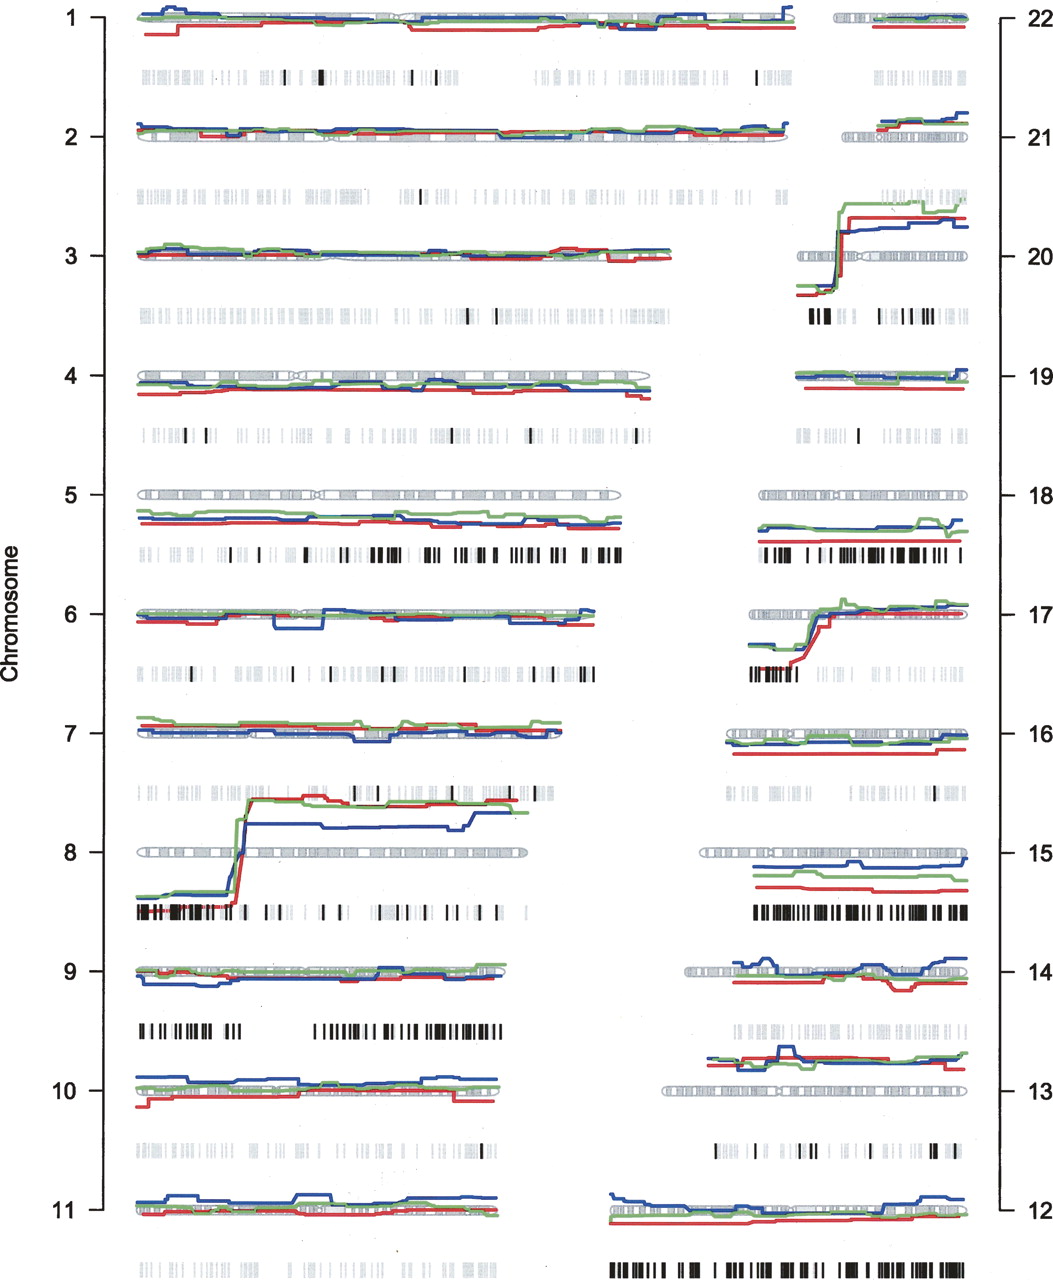
Figure 3.
Comparison of platforms for calculation of copy numbers for tumor T106. Smoothed values are plotted along idiograms. Red, GeneChip; green, BAC array; blue, BeadArray. Below each idiogram, gray bars indicate heterozygous SNPs in the corresponding normal sample. Loci that are not heterozygous in the tumor are shown as black bars.


