
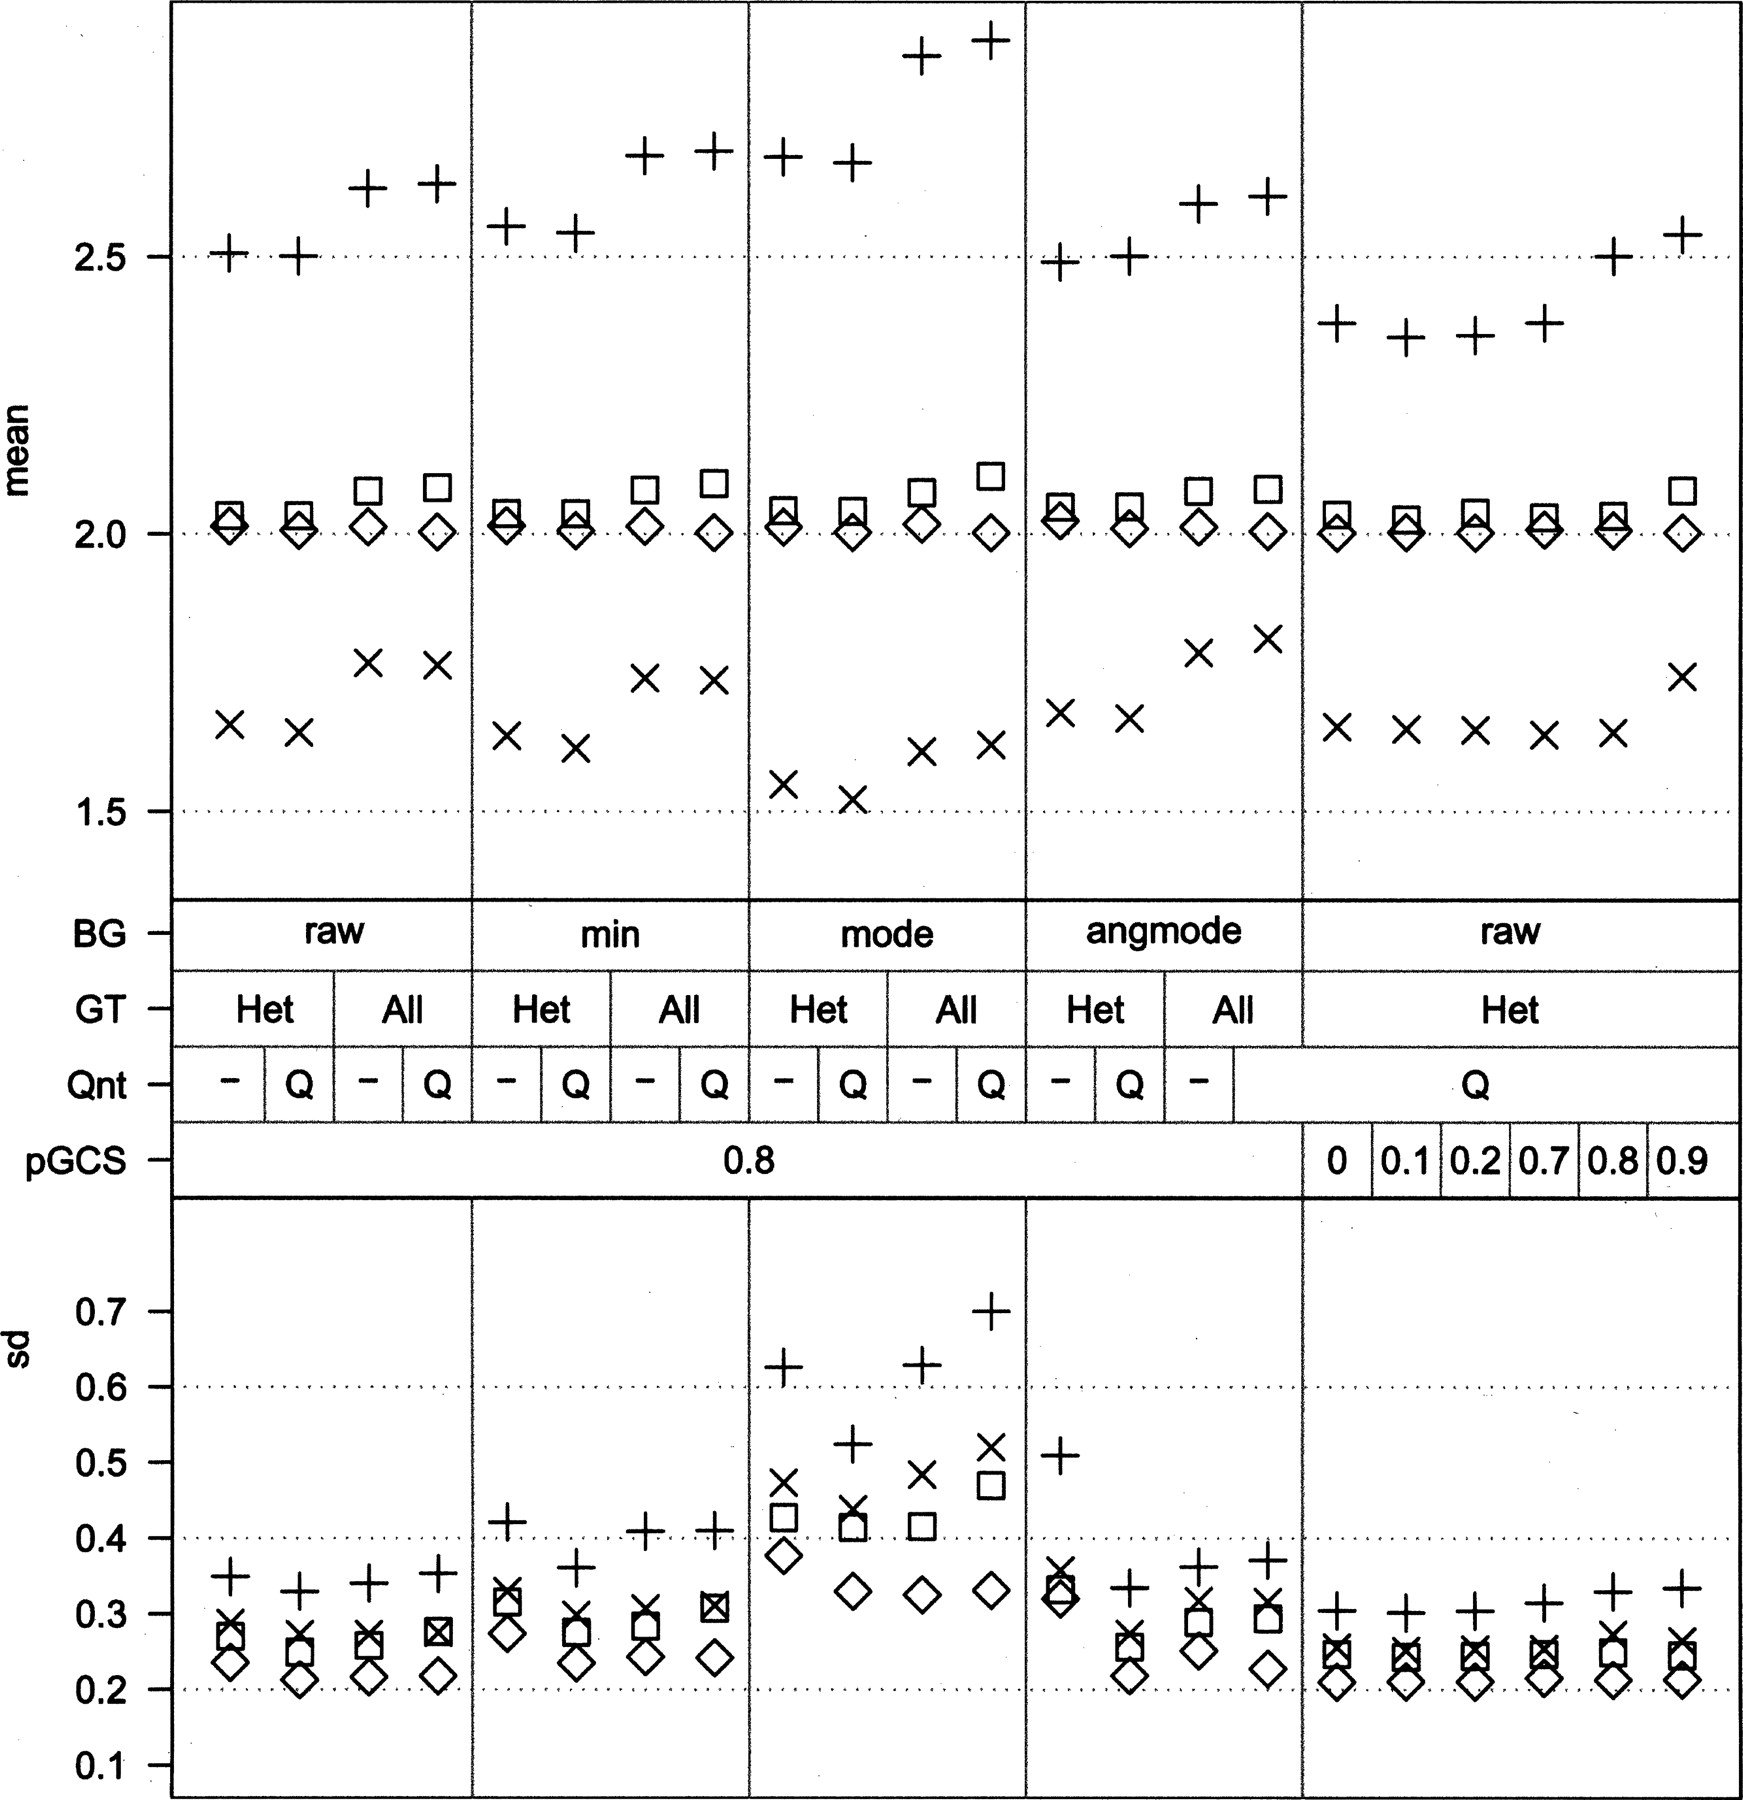
Effects of background estimation and sample normalization. The effects on amplitude (top panel) and variability (bottom panel) of different preprocessing and normalization strategies on the same data set are shown. The symbols indicate different copy number states: ◇, blood; ◽, tumor, normal; ×, tumor, loss; +, tumor, gain. The middle panel indicates the settings. BG, background estimation method: raw, no background estimation; min, minimum intensity in sample; mode, mode of intensities in sample; angmode, mode of angle in polar coordinates near the quadrants. Qnt: Q indicates quantile normalization between channels of a sample. GT: All, use all loci for normalization; Het, use heterozygous loci to calculate normalization factor. pGCS, proportion of relative gene call score. Use only loci with GCS higher than value to calculate normalization factor.


