
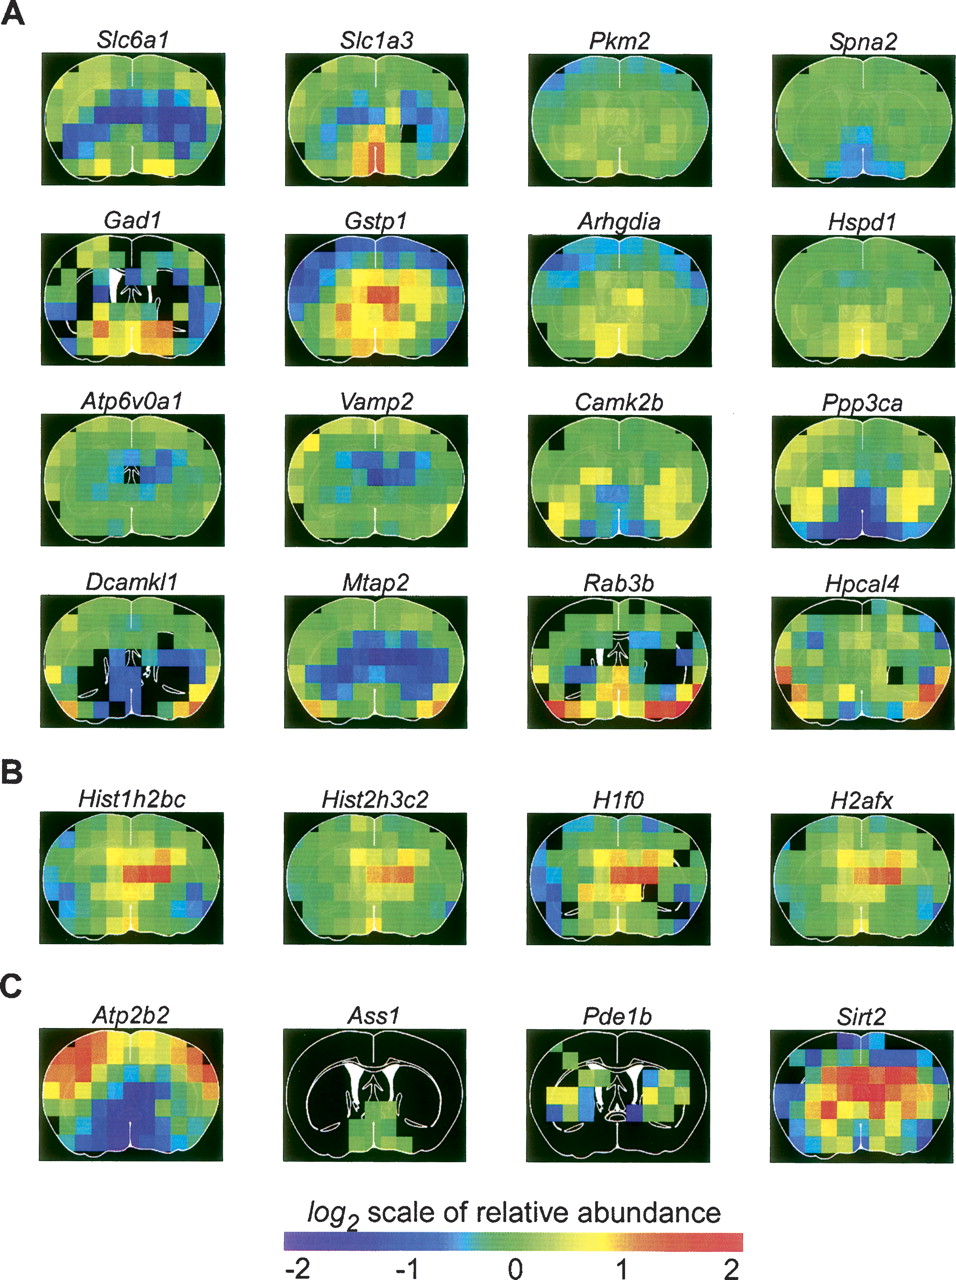
Figure 4.
(A) Examples of proteins having complex abundance patterns. (B) Histone proteins classified with predominant abundance in the center have no correlation with mRNA abundance data. (C) Selected examples of protein abundance patterns of genes with previously uncharacterized expression patterns in the mouse brain. Relative protein abundance values are encoded by color. Black regions inside the contour of the coronal slice indicate that the protein was not detected for the given voxels.


