
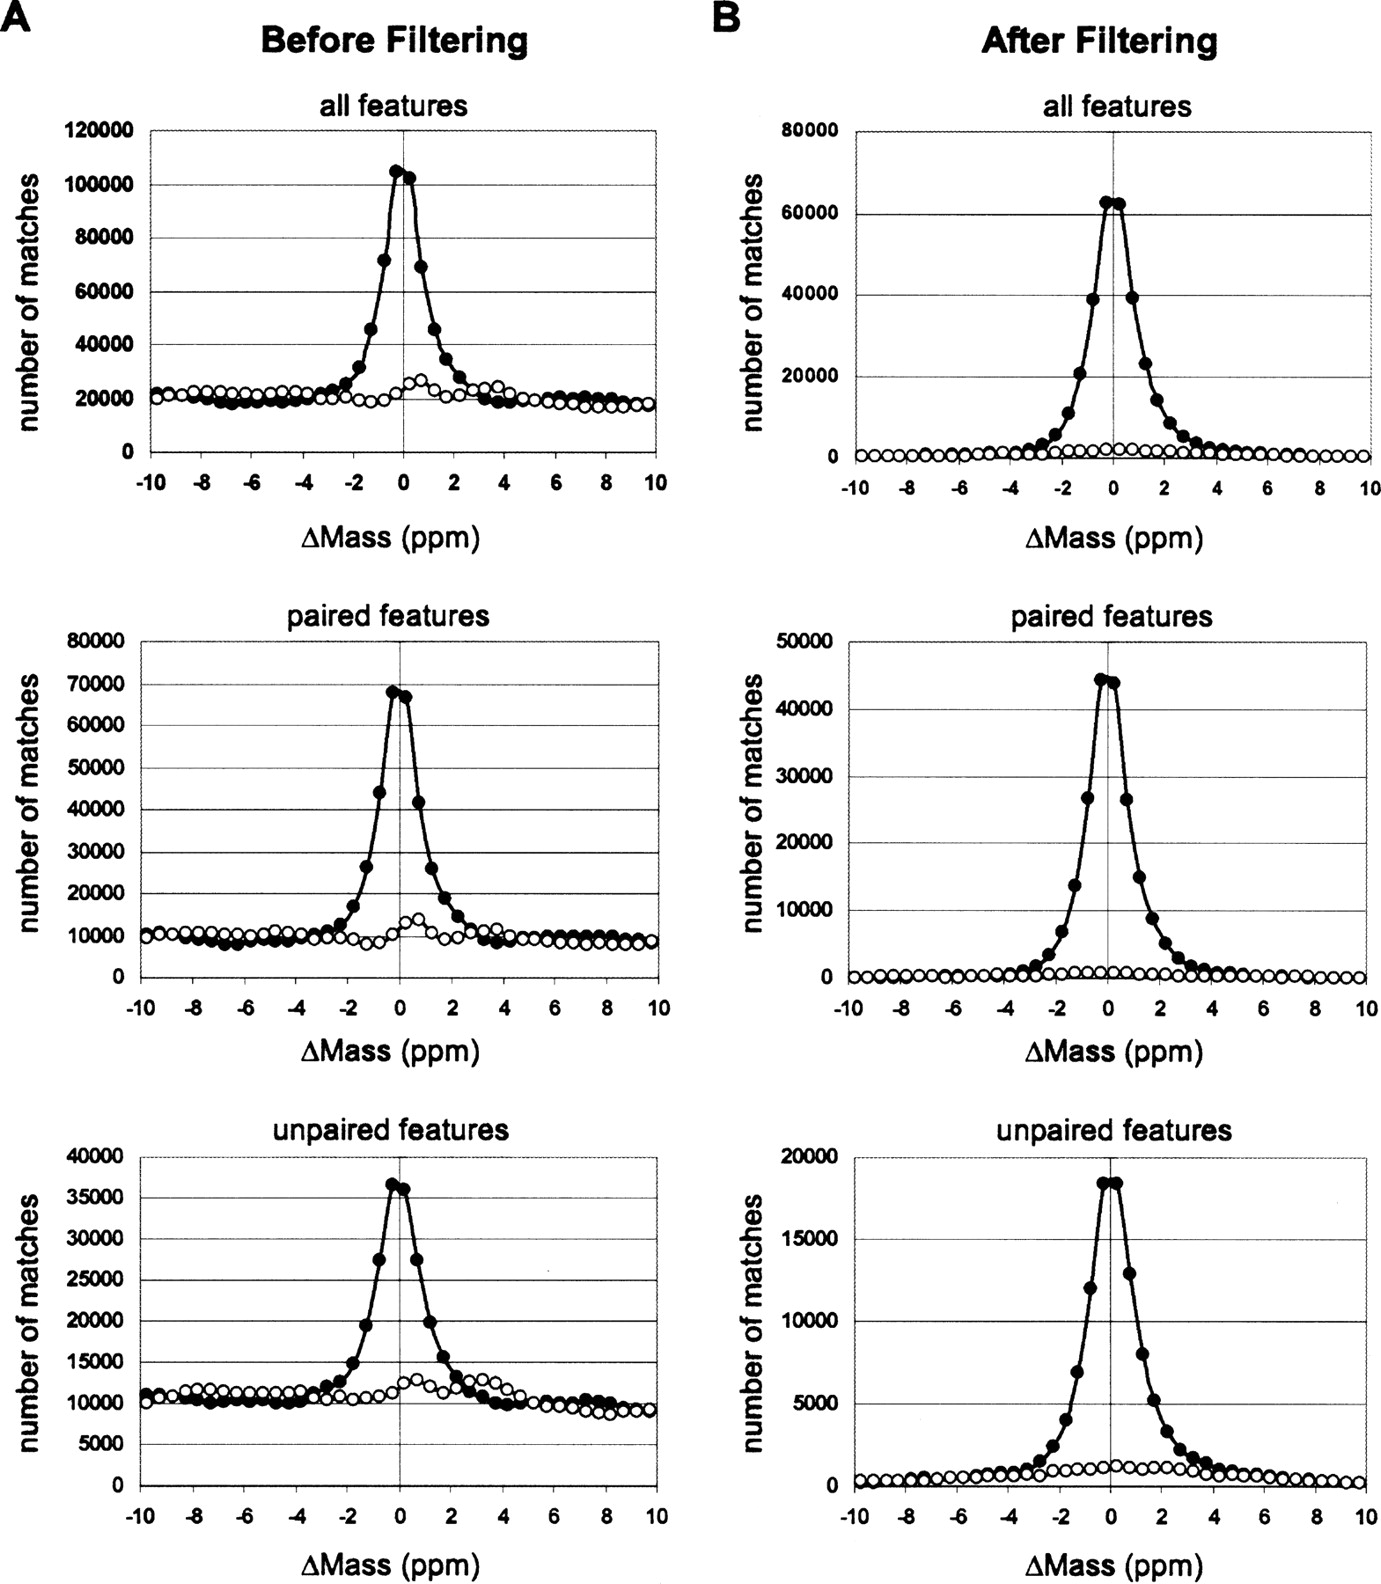
Mass error distribution histograms of feature–peptide matching to the merged AMT tag database, before (A) and after (B) applying filtering (step 1 in Table 1) except mass error tolerance cutoff. The number of matches combined from all 71 MS datasets. Solid circles represent matches to the normal AMT tag database. Open circles represent matches to the 11 Da shifted AMT tag database. The FDR rate after filtering (B) can be estimated as a ratio of area beneath the curve representing matches to the shifted database to the area beneath the curve representing matches to the normal database within respective mass error tolerances: ±2.3 ppm for paired features and ±2.0 ppm for unpaired features.


