
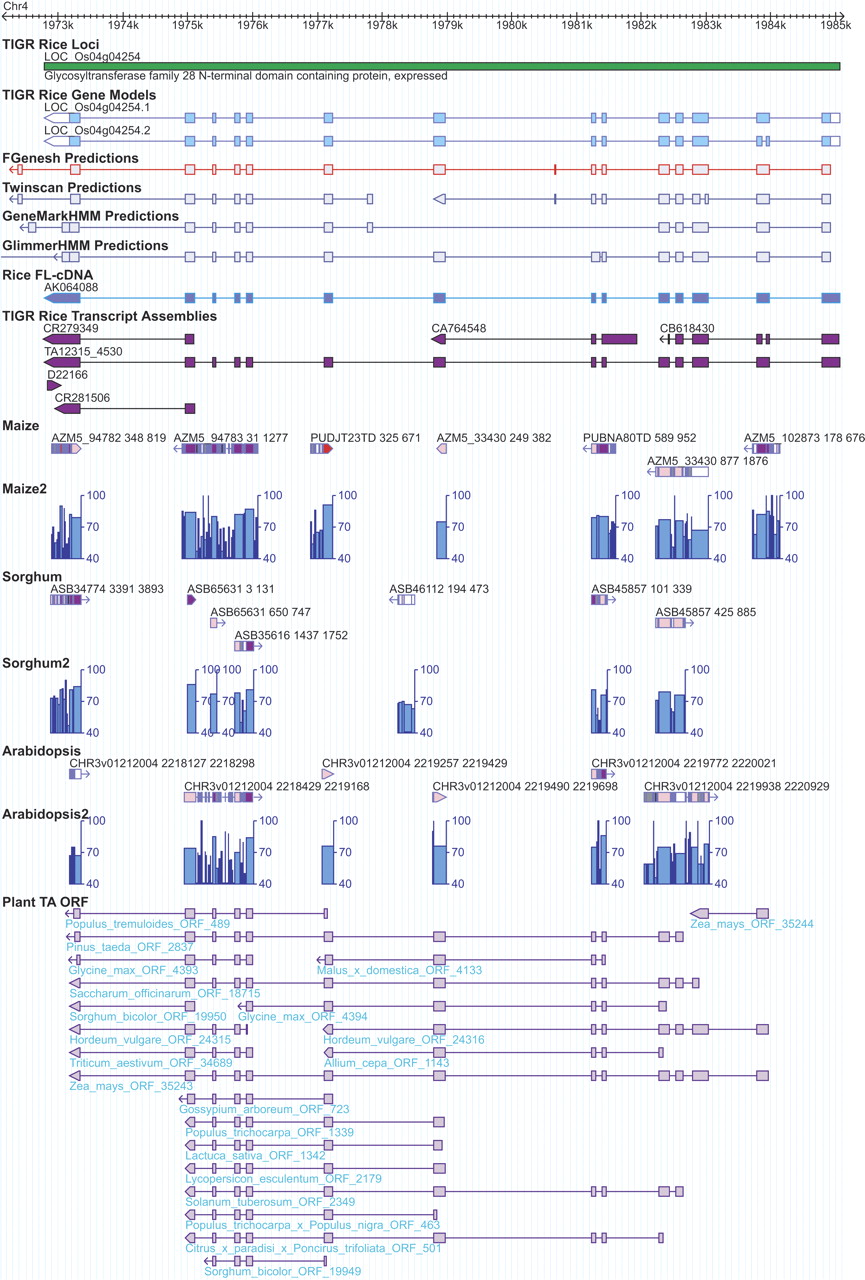
Example of a rice gene (LOC_Os04g04254) supported by additional evidence derived from the comparative analyses. The green bar represents the TIGR rice locus with the locus name above and the putative function assignment below the track. There are two gene models (i.e., alternative splicing isoforms) predicted for this locus as shown in the track “TIGR Rice Gene Models,” in which exons are represented by rectangles and introns by the intervening horizontal thin lines. The coding regions of the gene model are in light blue, distinguished from the untranslated regions, which are in white. The genes prediction program output (FGENESH, TWINSCAN, GeneMark.hmm, and GlimmerHMM) and the spliced alignments of the rice cognate full-length cDNAs and TAs are displayed in a similar manner as the gene models. Above the transcript alignment tracks are the GenBank accession numbers or TA identifiers to indicate the sequence data source. Below the transcript alignment tracks are the BLASTZ alignments between rice and maize, sorghum, Arabidopsis. Each BLASTZ alignment is composed of one or more gap-free blocks interspersed with gaps (or insertion/deletions). Each block is represented by a rectangle with the color for the average sequence identity within the block: red color (>90% identity), purple (80%–90% identity), pink (70%–80% identity), light gray (60%–70% identity), gray (50%–60% identity), and black (<50% identity). The gaps (not introns) between the flanking blocks are represented by the horizontal thin line. Each BLASTZ alignment feature is also labeled with the sequence identifier, which is followed by two numbers marking the start and end points of the match in the assembly. For example, ASB assembly ASB45857 has two matches with the genic region of the rice gene LOC_Os04g04254 which are separated by a 1-kb intron in the rice genome. The labels “ASB45857 101 339” and “ASB45857 425 885” indicate that the two matched regions have a gap of 85 (= 425 – 339 – 1) bp in the sorghum genome. The tracks “Maize2,” “Sorghum2,” and “Arabidopsis2” displayed the exact same BLASTZ alignment data but in alternative manners: The sequence identity is represented by the height of the column and the block size is represented by the column width. The cross species spliced alignments are displayed in the last track “Plant TA ORF” (for details, see Methods). As shown in the figure, the exonic regions have higher sequence identity than the neighboring intronic regions in the BLASTZ alignments. The gene structure of the gene LOC_Os4g04254 is well supported by rice full-length cDNA and rice TAs as well as the TAs from other plant species such as apple (Malus x domestica), barley (Hordeum vulgare), loblolly pine (Pinus taeda), lettuce (Lactuca sativa), maize (Zea mays), onion (Allium cepa), soybean (Glycine max), and sugarcane (Saccharum officinarum).


